
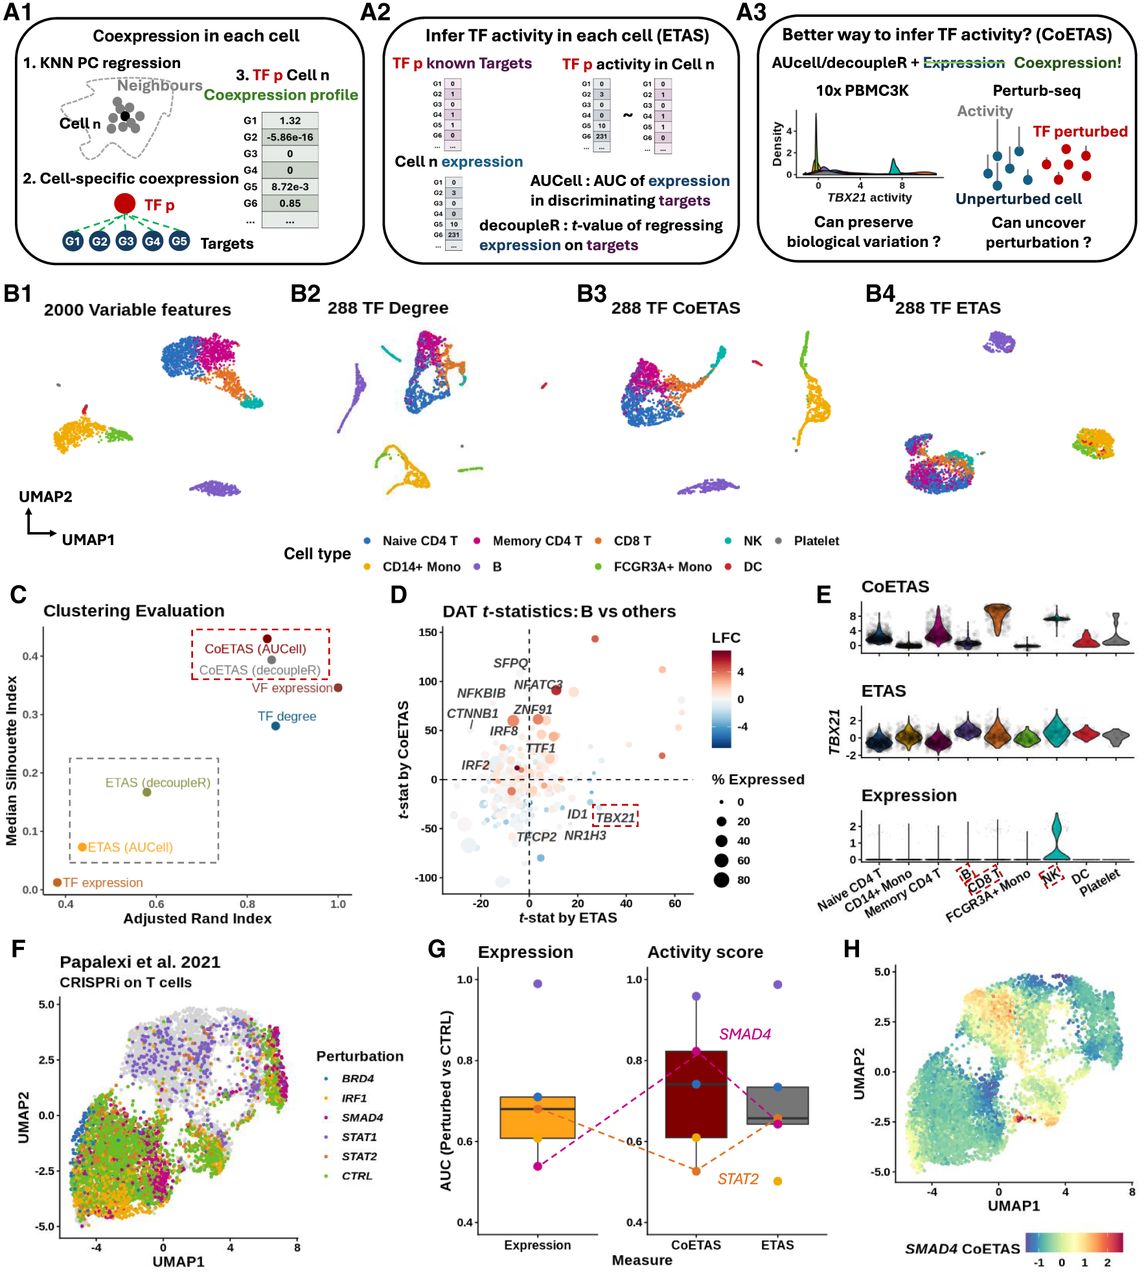
Coexpression between transcriptional factors and targets provides robust evidence to active gene regulation. (A) (A1) NNet measures the coexpression between each TF and its potential targets in each cell’s neighborhood, generating a TF–target coexpression profile. These profiles serve as input for TF activity inference. (A2) Traditional methods such as AUCell and decoupleR typically use target gene expression to infer TF activity, which can be misleading if high expression does not reflect active regulation. (A3) With NNet, AUCell or decoupleR are instead applied to coexpression profiles rather than expression profiles. This approach is expected to yield activity scores that better reflect true TF regulation. We benchmarked all approaches by comparing combinations of input (expression vs. coexpression) and method (AUCell vs. decoupleR). (B) UMAP visualization of PBMC 3K data. Cells were embedded with (B1) the 2000 most variable features (VFs), (B2) node degree for 288 TFs in cell-specific networks, (B3 vs. B4) TF activity inferred from coexpression (CoETAS) versus expression (ETAS) using decoupleR. CoETAS preserves cell-type boundaries more effectively, resulting in clearer clustering. (C) The adjusted Rand and silhouette indexes were used to quantify clustering quality based on TF activity scores. Including the 2000 VFs and 288 TF expression as controls confirms CoETAS’s superior clustering performance, matching (B3). (D) t-tests on decoupleR-derived CoETAS and ETAS identified differentially activated TFs. The x- and y-axes show t-statistics from ETAS and CoETAS, respectively. TFs are colored by their log-fold change expression in B cells versus other cell types and sized by the percentage of B cells expressing the TF. Many TFs marked as active by ETAS alone (e.g., TBX21: a T/NK cell regulator) have low expression in B cells, suggesting false positives. (E) Comparing TBX21 activity across cell types shows that ETAS (top) mistakenly marks TBX21 as active in B cells, whereas CoETAS (middle) correctly highlights its known role in T/NK cells. The bottom panel shows TBX21’s log-normalized expression. (F) UMAP of the Perturb-seq data set from Papalexi et al. (2021), with cells carrying TF perturbations highlighted. (G) For 5 TF perturbations, ETAS and CoETAS were computed using decoupleR and evaluated by their ability to distinguish perturbed cells from controls using area under the curve (AUC). TF expression was served as a baseline. On average, CoETAS outperformed both ETAS and the baseline, with a particularly strong improvement for SMAD4. CoETAS performed poorly for STAT2, whose perturbed cells show little separation from controls in F. (H) CoETAS scores for SMAD4 show a distinct activity drop among SMAD4-perturbed cells.


