
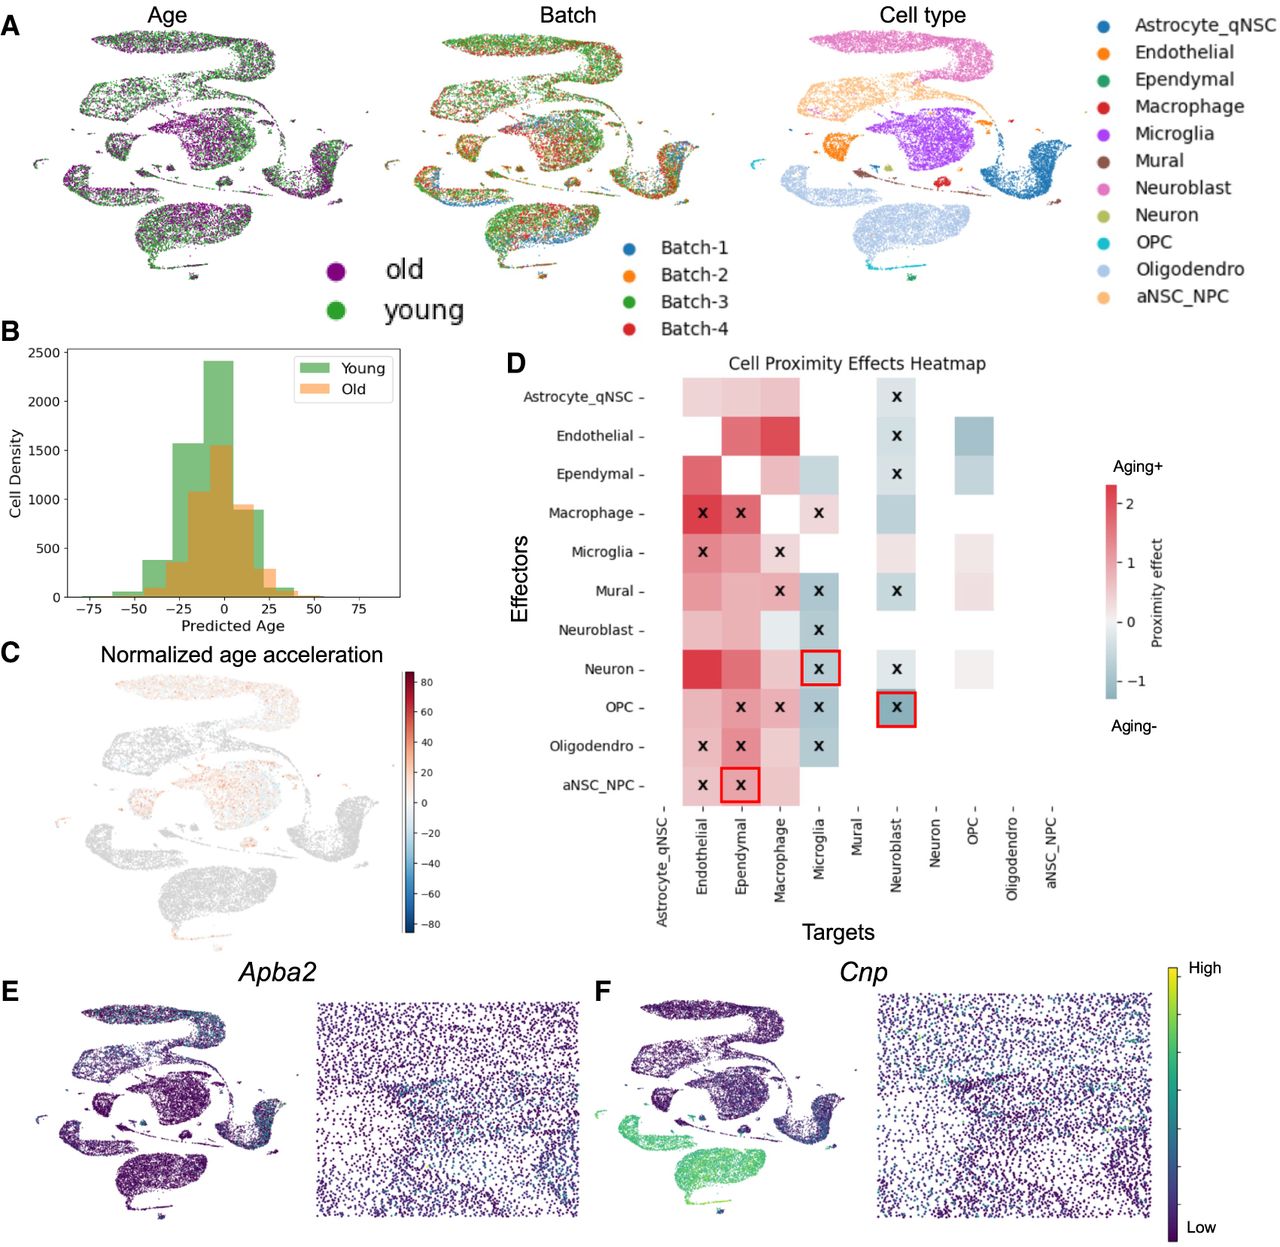
The aging effect analysis based on scRNA-seq data. (A) The UMAP visualization of measured scRNA-seq data colored by age (left panel), batch label (middle panel), and cell type (right panel). (B) The cell density of predicted cell age colored by observed age information. (C) The UMAP visualization of measured scRNA-seq data colored by normalized age acceleration effect. (D) The cell proximity effect of cell types based on the scRNA-seq data. (E) and (F) represent examples of expression patterns of age-specific marker genes shared by both scRNA-seq data and spatial transcriptomics. Apba2 (E) is a marker from young group and Cnp (F) is a marker from old group. For each gene, the left panel represents UMAPs of scRNA-seq data and the right panel represents spatial location of spatial transcriptomics. Each panel is colored by gene expression levels.


