
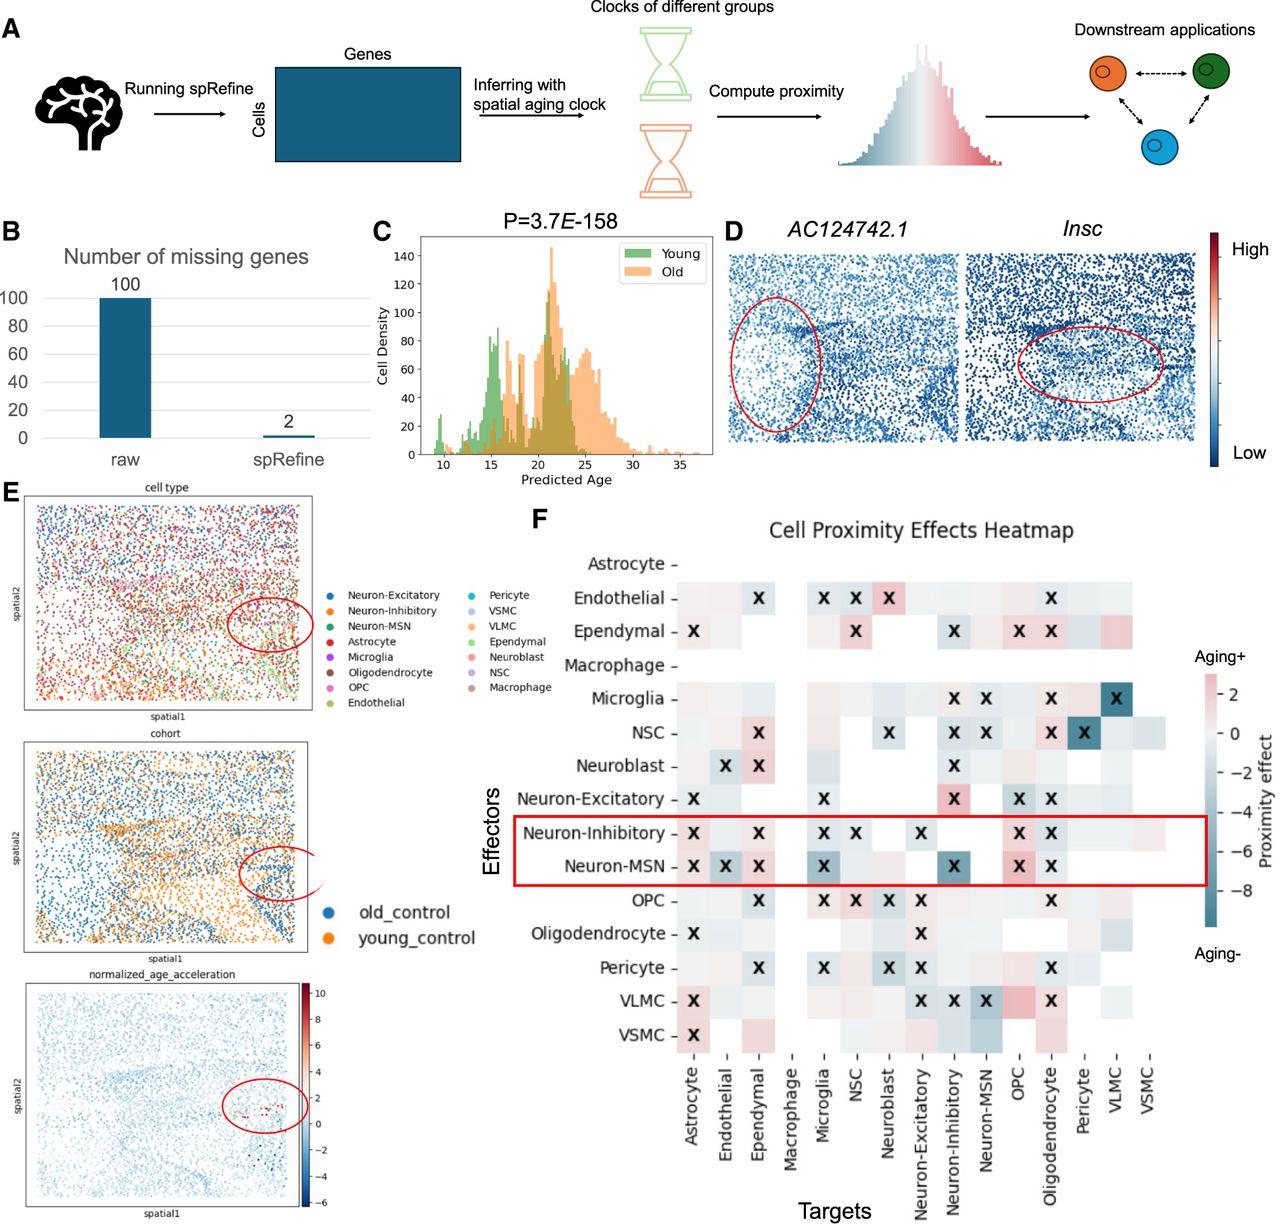
Leveraging contributions of spRefine to understand the biological structure of aging at the spatial level. (A) The pipeline of aging effect estimation with spRefine. (B) Comparison of the missing genes between the raw gene set and the imputed gene set. (C) The density of cells predicted with different ages, and the colors represent the measured age group. (D) The spatial-level expression patterns of two selected DEGs from different age groups. Highly expressed regions are highlighted. (E) Visualization of spots colored by cell types, age groups, and normalized age acceleration rate based on spatial location. The area with a strong aging association was highlighted in a red circle. (F) Heatmap of cell proximity effects by measuring the interactions of different cell types.


