
Figure 6.
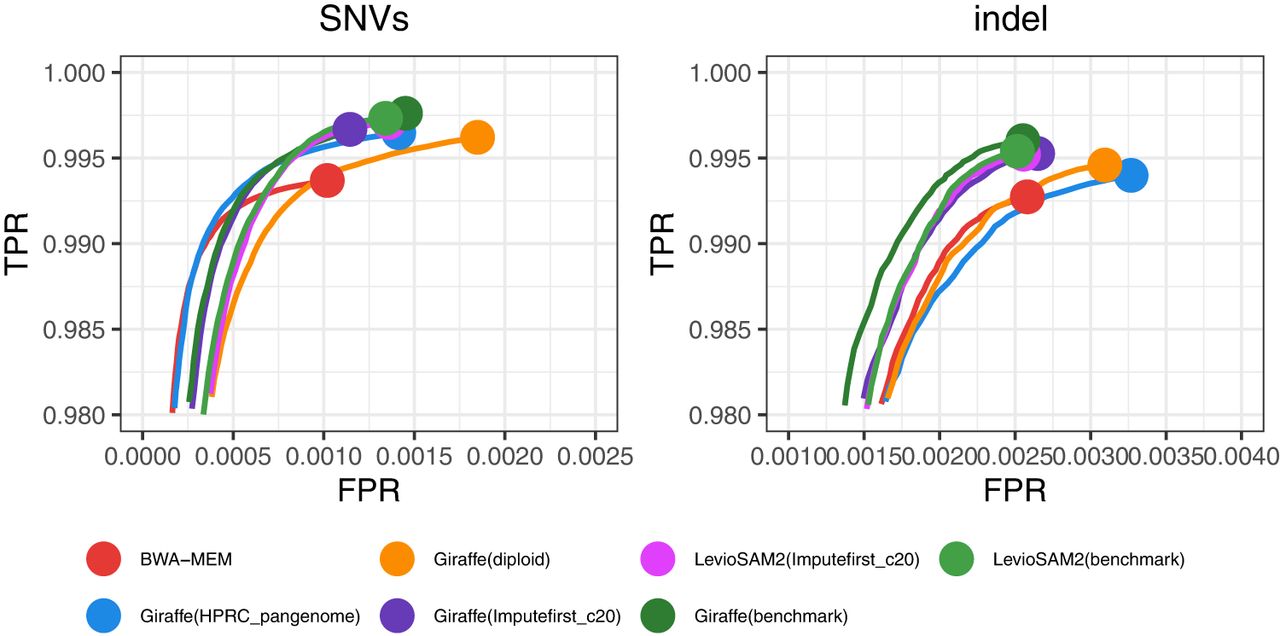
ROC curves for overall variants of HG002 sample, from Hap.py ROC data stratified on SNVs and indel variants. ROC curves are stratified by the default QQ threshold for ROC.
(Downloading may take up to 30 seconds. If the slide opens in your browser, select File -> Save As to save it.)
Click on image to view larger version.
ROC curves for overall variants of HG002 sample, from Hap.py ROC data stratified on SNVs and indel variants. ROC curves are stratified by the default QQ threshold for ROC.
 CiteULike
 Delicious
 Digg
Digg Facebook
 Google+
 Reddit
 Twitter
