
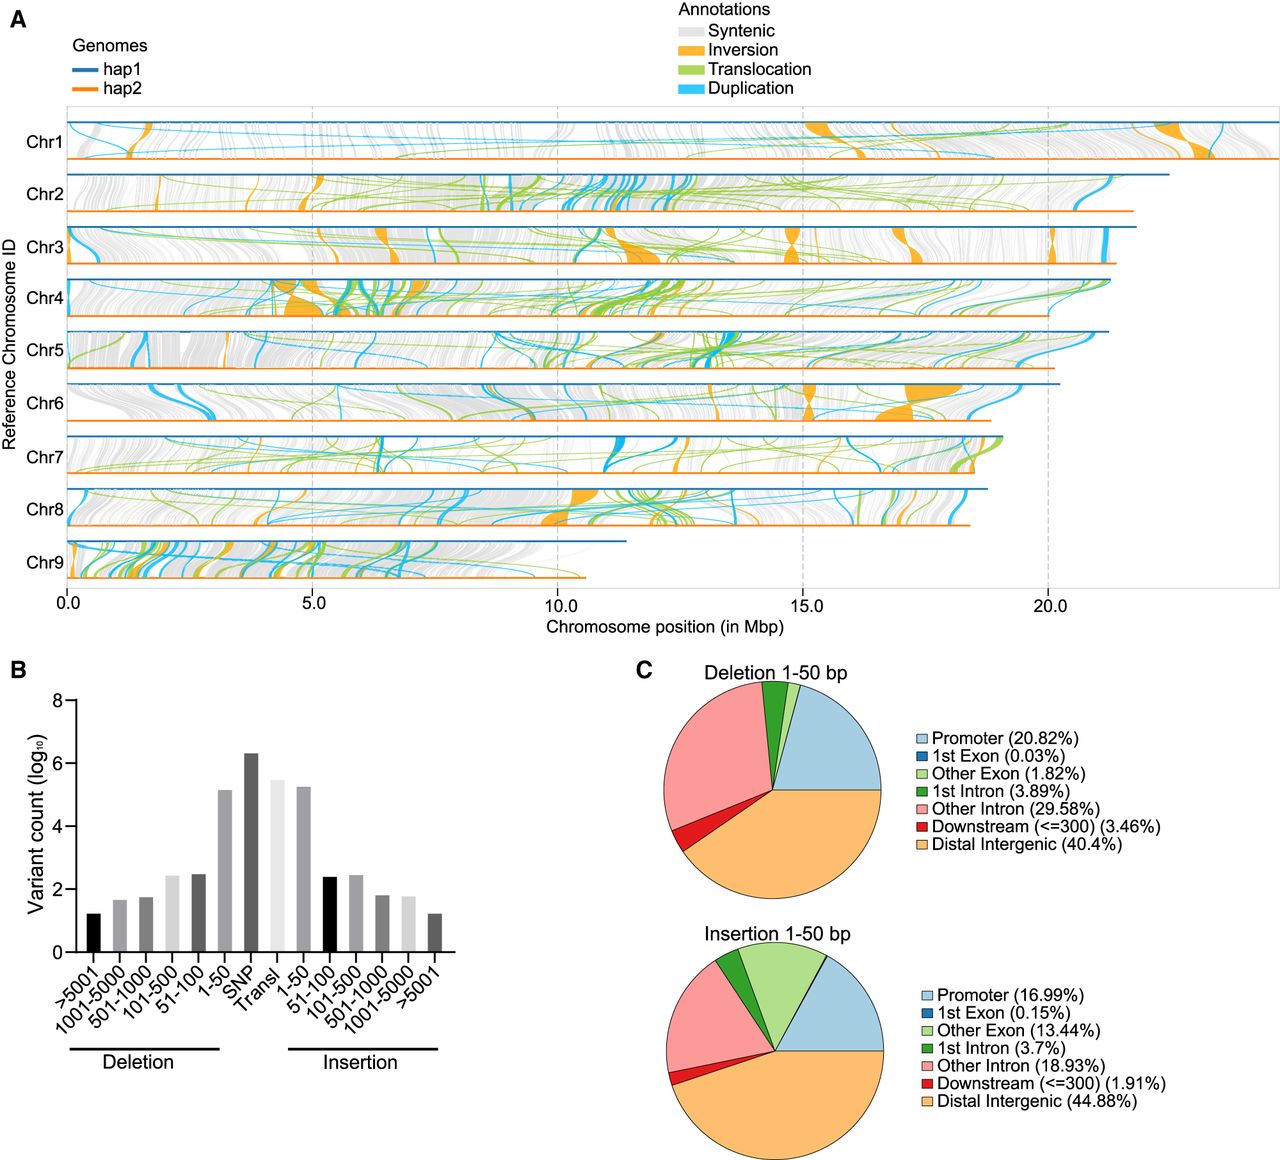
Figure 2.
Structural variations between haplotypes. (A) Syntenic analysis of the A. avenae genome. (B) The distribution of variation length was shown using the hap1 genome as reference, and ordinate numbers were logarithmically transformed. (C) Genome-wide annotation of deletion and insertion mutations smaller than 50 bp.


