
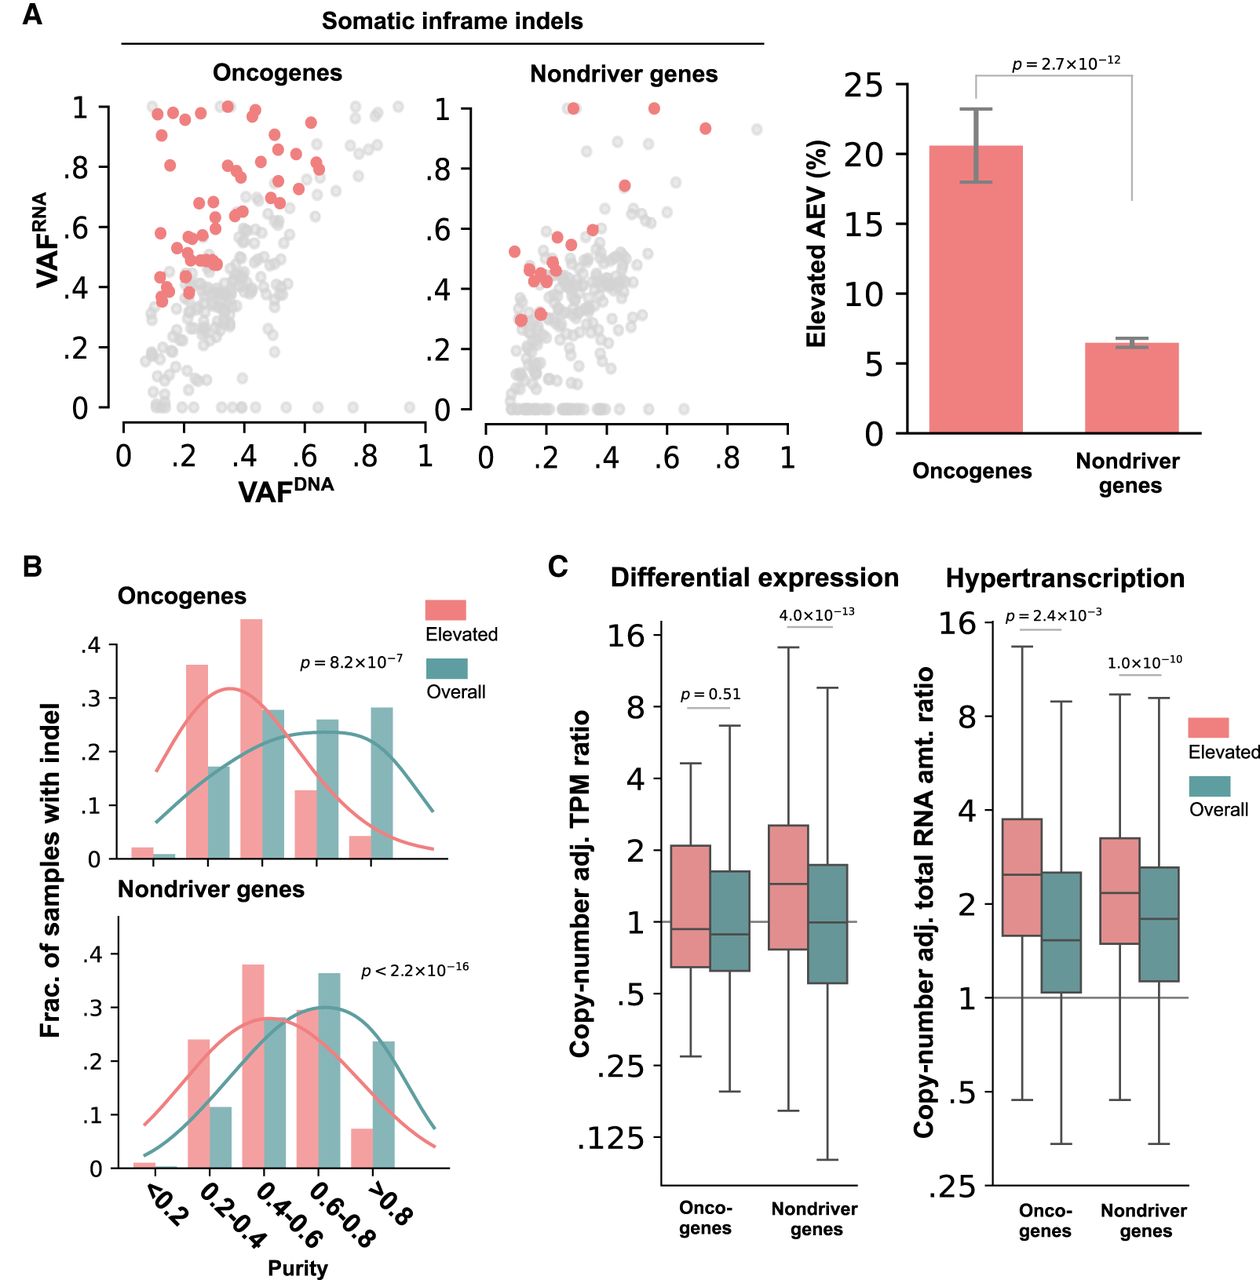
Evaluation of the AEV model using somatic in-frame indels in TCGA samples. Elevated AEV prevalence, comparison of tumor purity, and tumor expression ratio in elevated AEV versus all indels are presented in A–C, respectively, using the same style and statistical test as the corresponding analyses in Fig. 3. (A) Comparison of elevated AEV indels in oncogene and nondriver genes using down-sampled nondriver indels for a scatter plot (left) and the full data set (238 indels in oncogenes, 5673 indels in nondrivers) for a bar plot (right). (B) Comparison of tumor-purity distribution in samples harboring elevated AEV indels (elevated) versus all indel-containing samples (overall). (C) Comparison of TPM ratio based on differential expression (left) and hypertranscription (right) between elevated and overall indels.


