
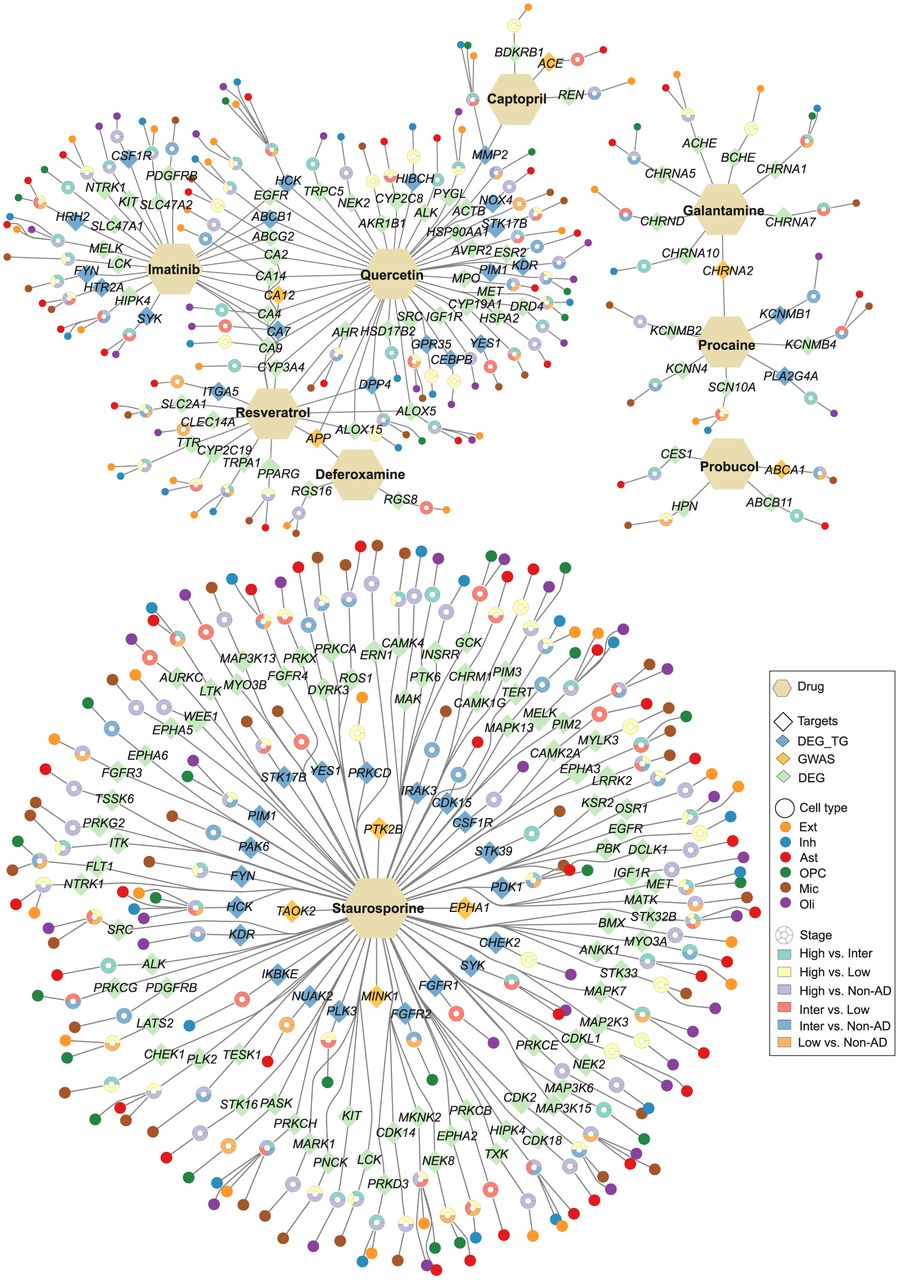
Drug–target network illustrating mechanisms of action for nine candidate drugs. Hexagon denotes drugs, and diamonds shape denote target genes. Green diamonds indicate targets that are differentially expressed genes (DEGs); blue represents targets are both DEGs and TFs’ targets; and yellow denotes genes located within AD-associated GWAS loci. When multiple criteria apply, the most specific class is displayed (blue → yellow → green). An annular ring around each target indicates the six comparisons of ADNC stage(s) at which the gene is a DEG; ring sectors correspond to high versus inter, high versus low, high versus non-AD, inter versus low, inter versus non-AD, and low versus non-AD. Small colored circles attached to stage(s) indicate the related six cell type(s) of DEGs. Edges represent curated drug–target interactions.


