
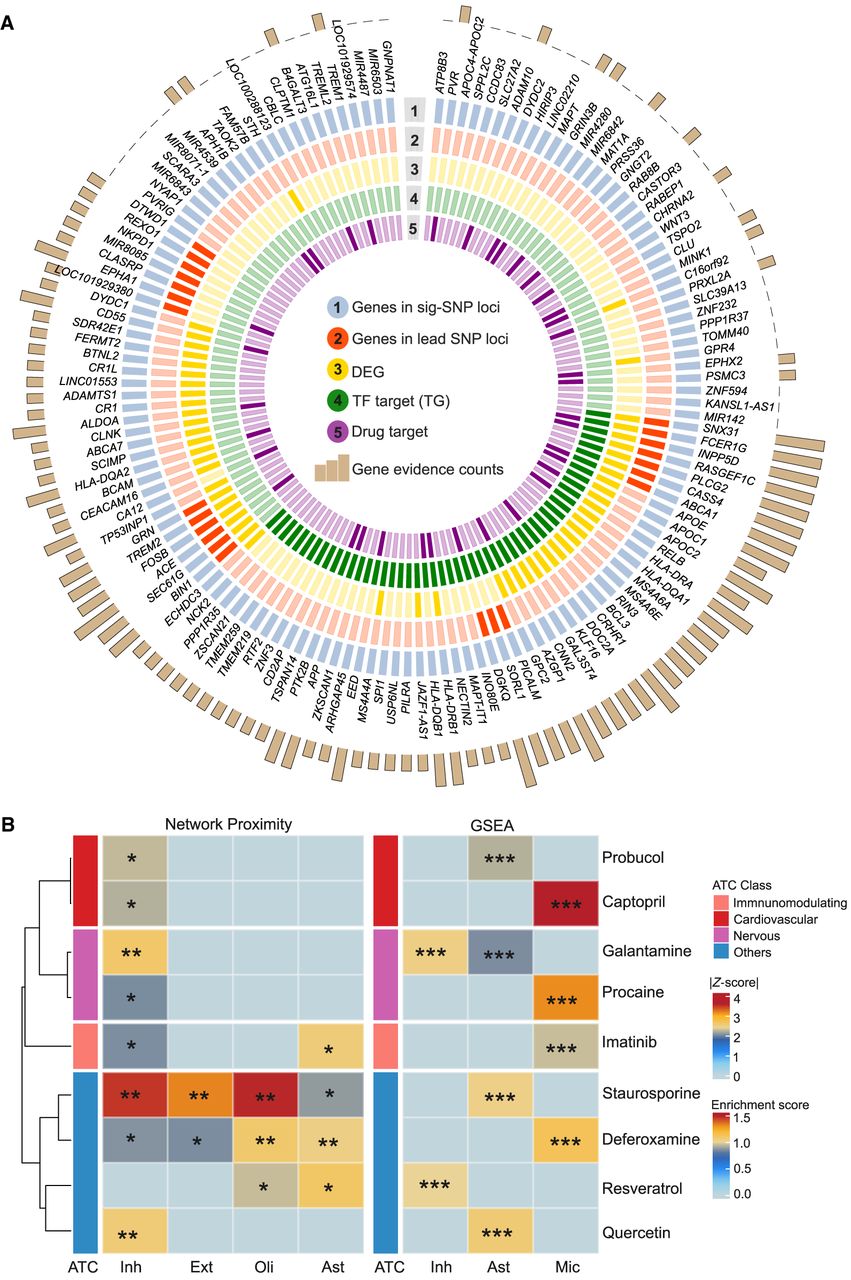
Highlighted repurposable drug candidates in a cell type–specific manner across AD progression. (A) Prioritized AD-associated genes by combining cCREs and significant AD-associated variants. The first circle with blue rectangles highlights genes identified by overlapping AD-associated significant SNPs loci with cell type–specific cCREs. The second circle with dark red rectangles represents genes associated with AD lead SNPs loci and cCREs. The third circle with dark yellow rectangles is DEGs. The fourth circle with dark green rectangles represents the target genes regulated by TFs. The fifth circle with dark purple rectangles comprises target genes annotated as known drug targets. The outer bar plot provides the evidence counts for each gene. (B) Predicted repurposable drug candidates by network proximity and GSEA clustered by ATC first-level class. Left panel shows enriched drug candidates identified by network proximity method, in which gradient colors reflect absolute Z-scores. Right panel shows enriched drug candidates identified by GSEA method, in which gradient colors represent enrichment scores. Statistical significance is denoted by (*) FDR < 0.05, (**) FDR < 0.01, (***) FDR < 0.001.


