
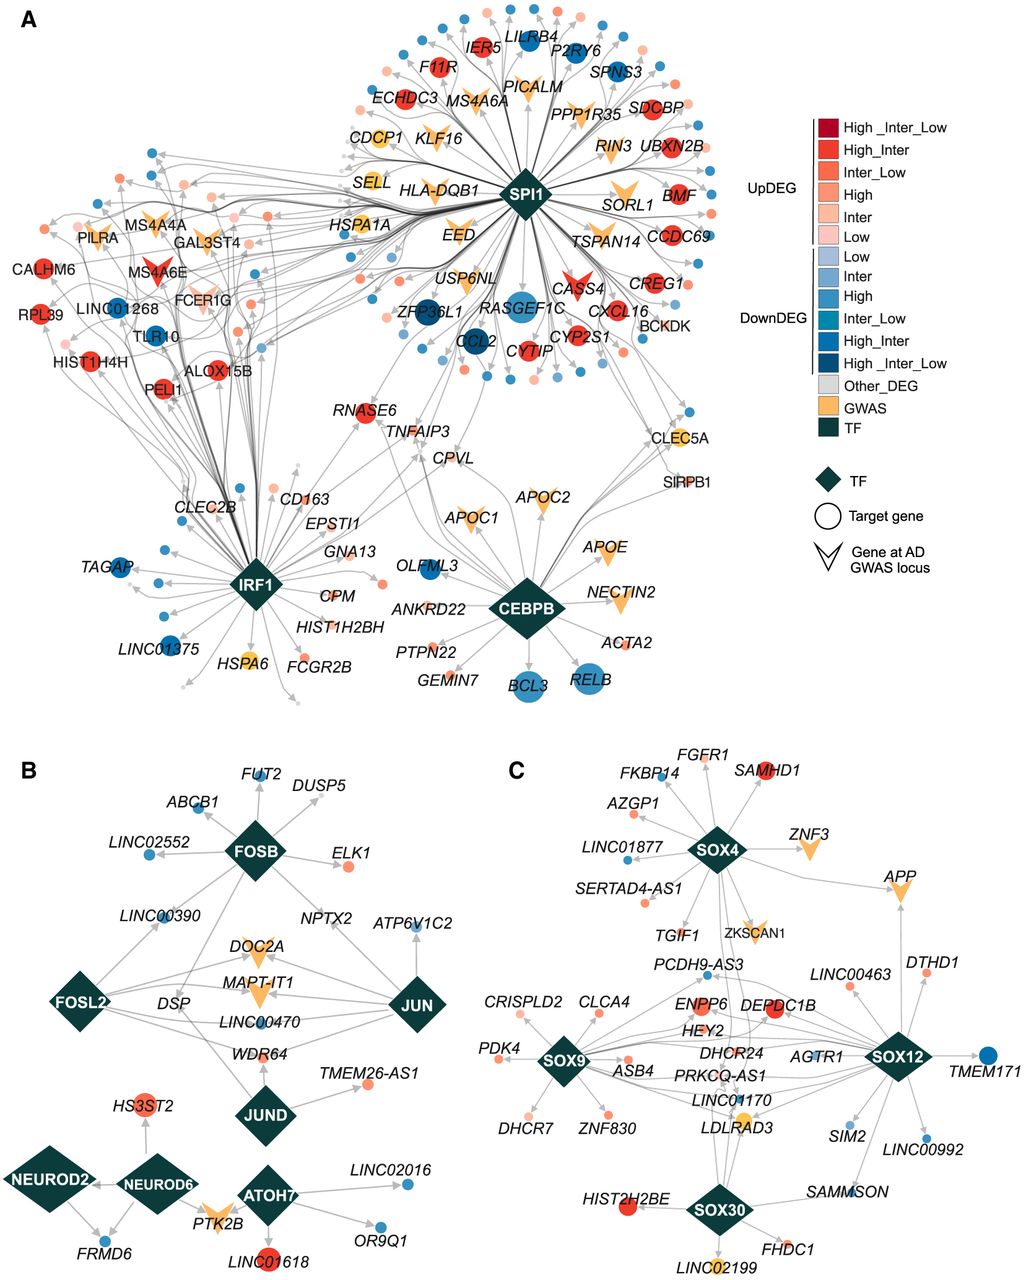
Cell type–specific TF regulatory network. (A) TF regulatory networks in microglia for SPI1, IRF1, and CEBPB, highlighting predicted candidate target genes that exhibit significant expression change during AD progression or are annotated in AD-associated GWAS locus. (B) TF regulatory networks in excitatory neurons for the TFs JUN, JUND, FOSB, NEUROD2, and NEUROD6, showing the predicted candidate target genes that were significantly changed during AD progression or annotated in AD GWAS locus. (C) TF regulatory networks in oligodendrocytes for the TFs SOX4, SOX9, SOX12, and SOX30, showing the predicted candidate target genes that were significantly changed during AD progression or annotated in AD GWAS locus. In all panels, the shape of diamonds represents TFs; circles represent target genes of TFs; and arrowheads indicate the target genes of TFs located within AD-associated GWAS loci. The red gradient denotes target genes annotated with upregulated DEGs at different stages of AD progression, and the blue gradient represents target genes annotated with downregulated DEGs. Genes with inconsistent DEG change across stages are labeled in gray.


