
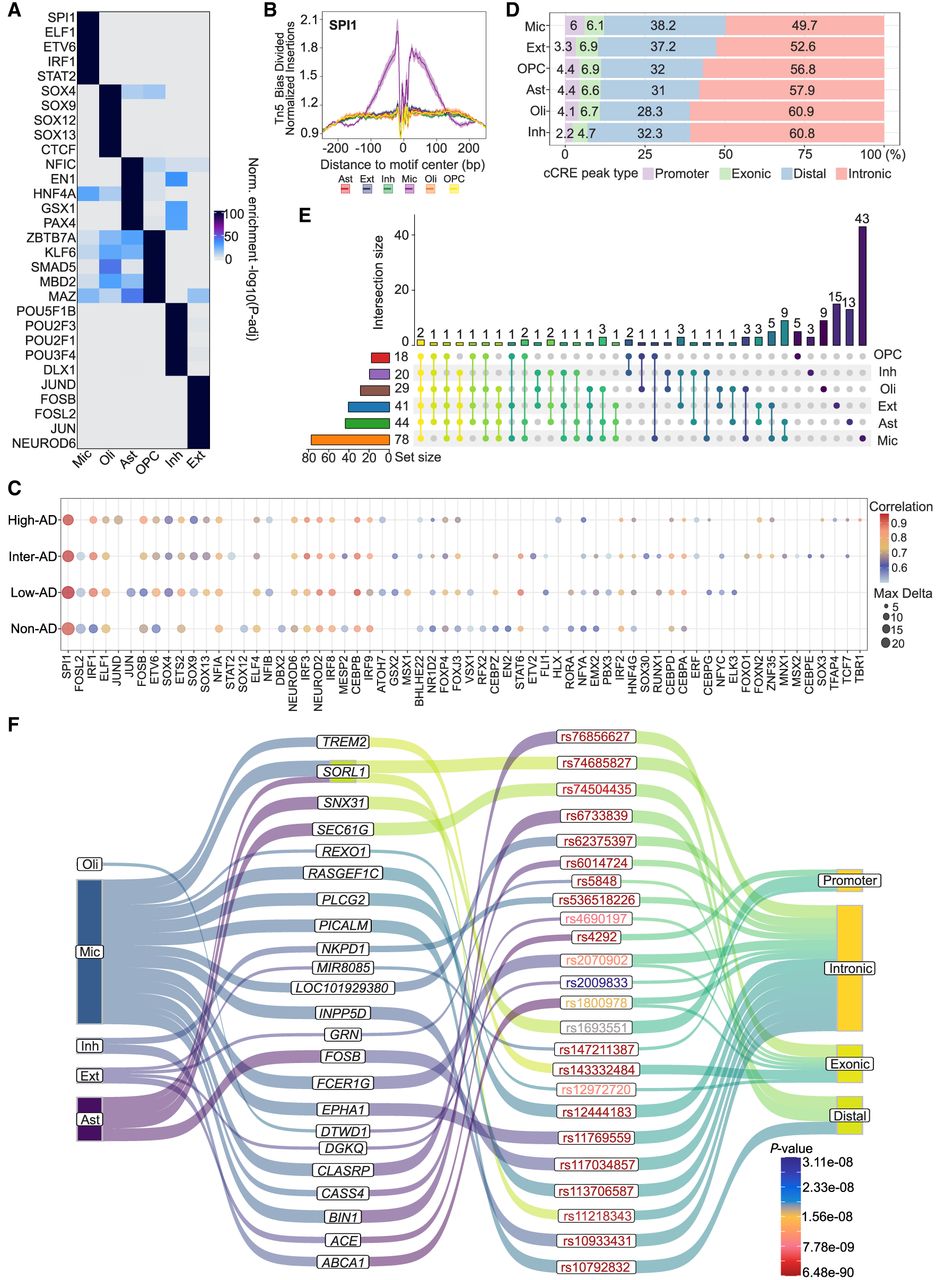
Positive TF-regulators and cell type–specific regulatory landscapes of GWAS loci across AD progression by integrative analysis. (A) Top enriched TF motifs for each cell type. The color scale represents −log10 (adjusted P-value) of the normalized enrichment score. (B) Tn5 bias-corrected TF footprinting for SPI1. (C) Positive TF-regulators for all cell type across AD progression. (D) The percentage of genomic region annotation for cell type–specific peaks. (E) Numbers of candidate genes associated with significant AD-related SNPs for each cell type. The left bar plot shows the total number of genes per cell type, and the top bar plot highlights genes that overlap between cell types or are unique to specific cell types. (F) Sankey plot illustrating the cell type–specific AD-associated lead SNPs and their potential target genes. The first column represents cell types; the second column indicates potential target genes linked to AD-associated lead SNPs; the third column lists AD-associated lead SNPs with P-values represented by scale bar color and indicated by different text colors; and the fourth column displays genomic region annotations for peaks associated with these lead SNPs.


