
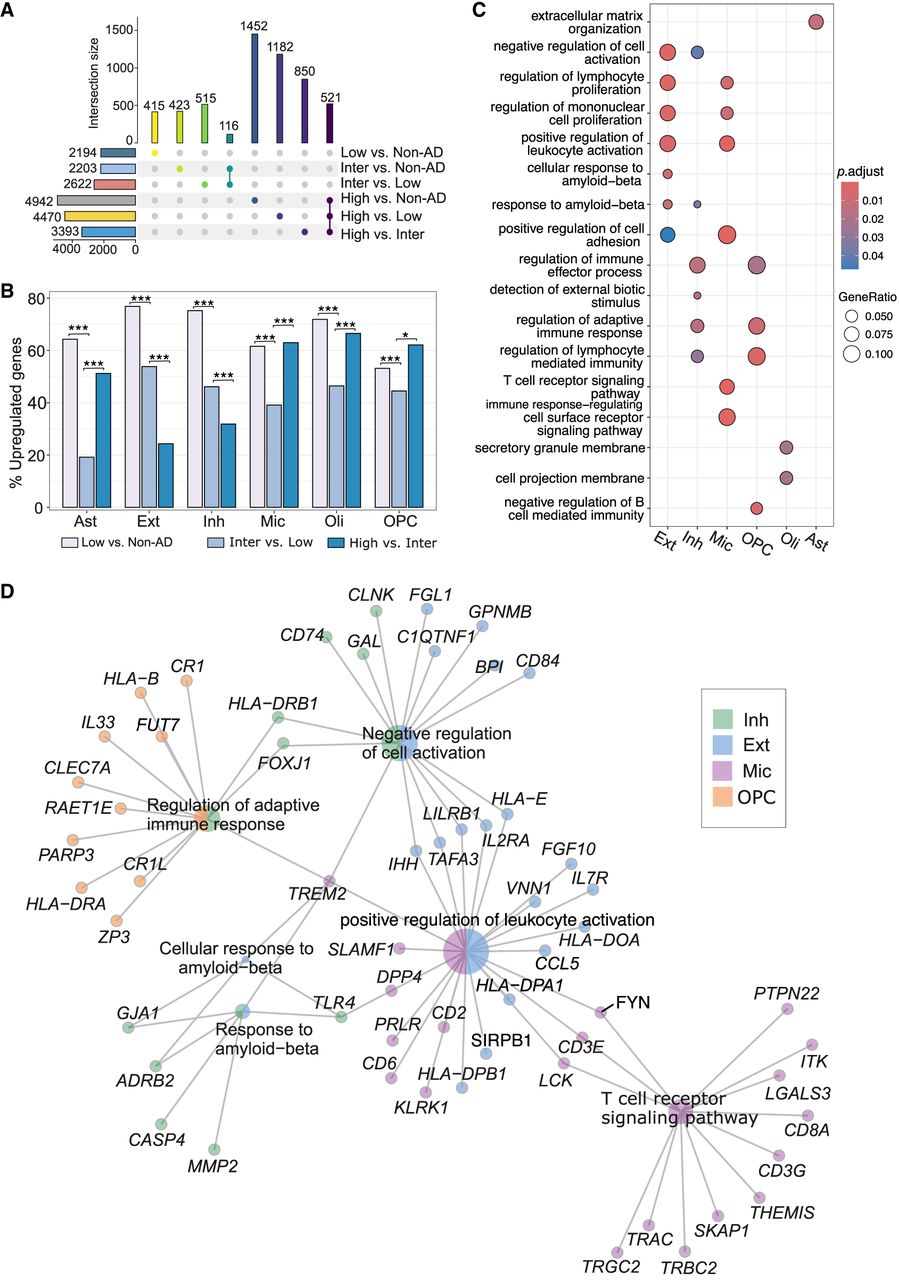
Gene expression changes across AD progression. (A) UpSet plot illustrating the number of DEGs across AD progression. The left bar plots display the total number of DEGs for each stage comparison group, and the top bar plots represent the number of DEGs that are either overlapping or unique to different groups. Colored dots connected by lines indicate the stage groups that have overlapping DEGs, and a single-colored dot represents the stage group without overlapping DEGs with other groups. (B) Percentage of upregulated DEGs number for each cell type across adjacent stages of AD progression. Statistical significance was assessed using the Chi-squared test, with P < 0.05 (*), P < 0.01 (**), and P < 0.001 (***). (C) GO functional enrichment analysis of each cell for upregulated DEGs during high-versus-inter stage. (D) Selected GO terms from C with corresponding genes. Different colors indicate distinct cell types, and the pie charts represent GO terms and associated genes shared across various cell types.


