
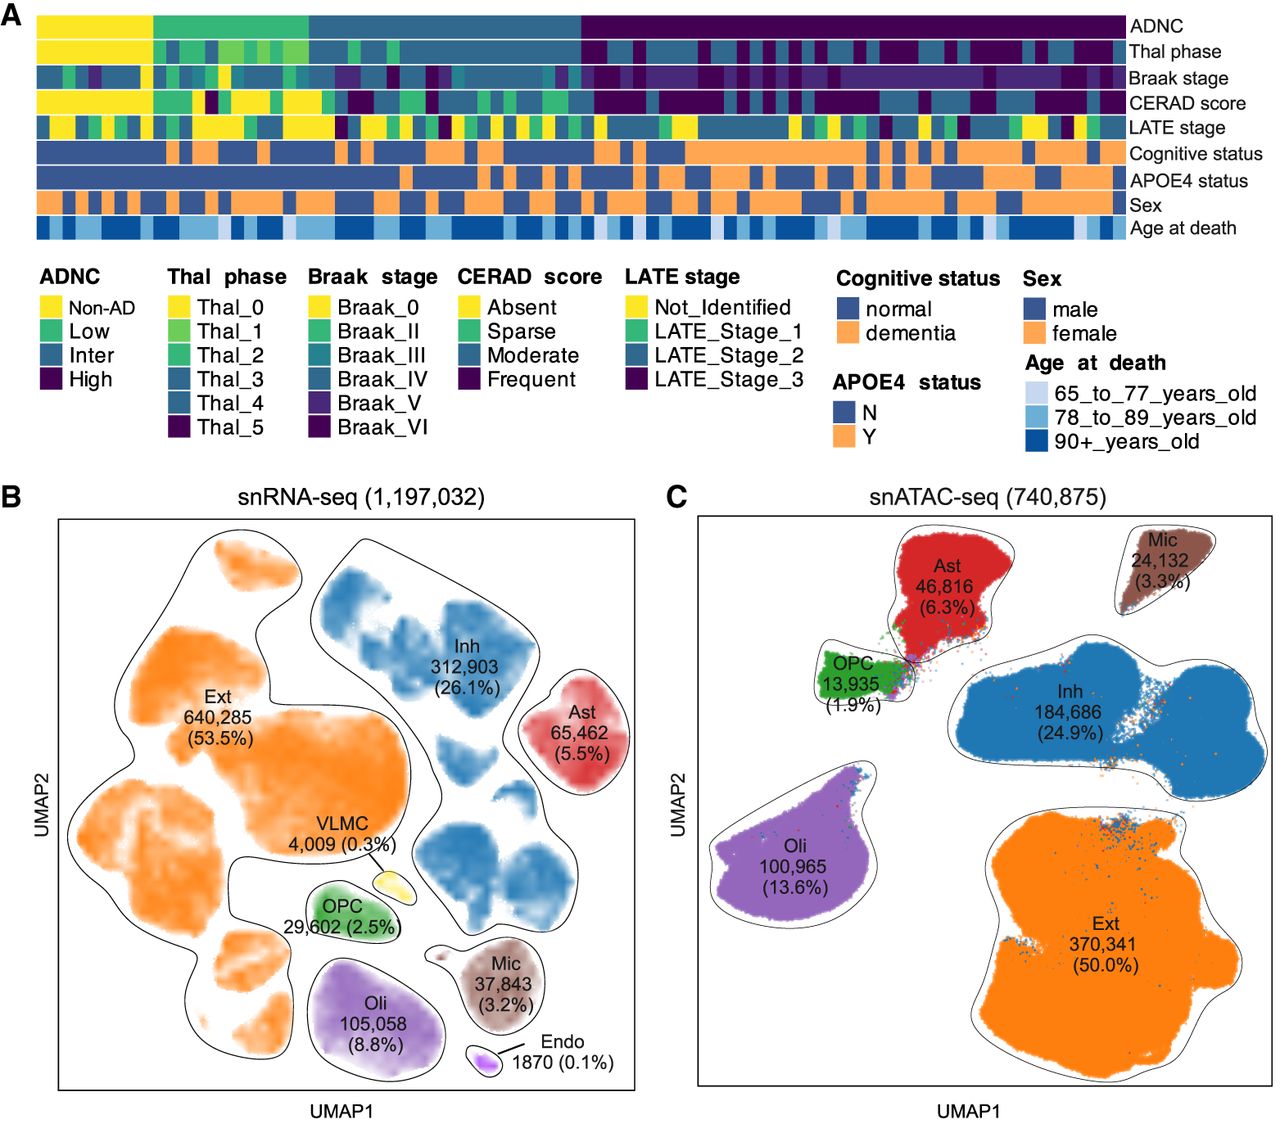
Figure 2.
Overview of snRNA-seq and snATAC-seq data sets. (A) Heatmap displaying metadata for 84 individual samples. The rows of the heatmap, ordered from top to bottom, represent ADNC, Thal phase, Braak stage, CERAD score, LATE stage, cognitive status, APOE4 status, sex, and age at death. (B,C) UMAP representation of snRNA-seq (B) and snATAC-seq (C) is shown. The figure also shows the cell count number and proportion of each cell type.


