
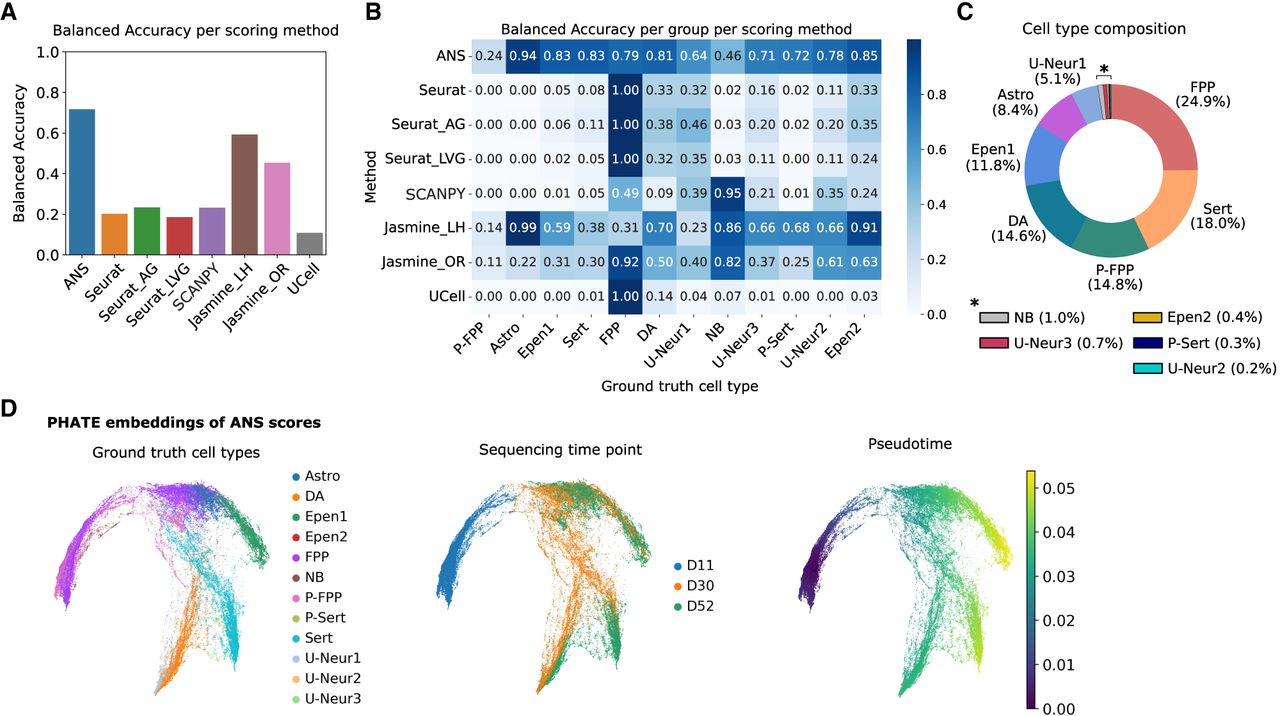
Benchmarking of score-based cell labeling using neuronal differentiation single-cell data set. (A) Overall balanced accuracy of score-based labels assigned based on the 12 cell signatures. (B) Cell-type-specific balanced accuracy across all benchmarked scoring methods. (C) Cell-type proportion distribution across the analyzed data set, including floor plate progenitors (FPP), proliferating floor plate progenitors (P_FPP), neuroblasts (NB), dopaminergic neurons (DA), serotonergic-like neurons (Serts), proliferating serotonergic-like neurons (P_Serts), astrocyte-like (Astro), ependymal-like 1 (Epen1), ependymal-like 2 (Epen2), and three unknown neuron groups 1–3 (U_Neur1, U_Neur2, U_Neur3). (D) PHATE embeddings generated based on the ANS scores of the 12 cell types. The plots are colored by ground-truth cell-type annotations, sequencing time points (days), and pseudotime estimated from the embeddings.


