
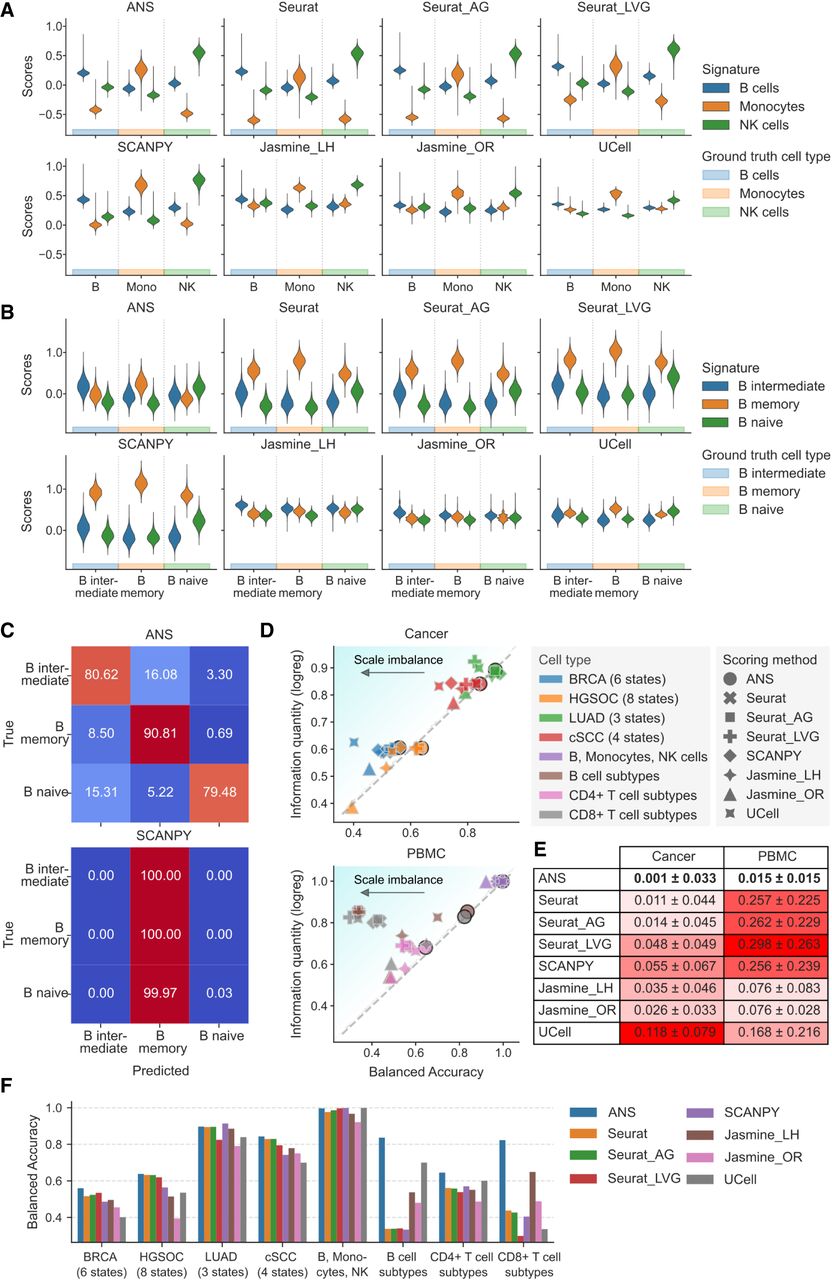
Comparative analysis of scoring methods for cell-type and cell-state annotation. Only nonoverlapping cell-type- or cell-state-specific signatures were used. (A) Score distributions for cell-type-specific signatures (B cells, monocytes, and NK cells) separated by true cell-type annotations, calculated for each scoring method. (B) Score distributions for B cell subtype signatures separated by true cell subtypes, calculated by each scoring method. (C) Row-normalized confusion matrix of B cell subtype annotation based on the highest scores. (D) Relationship between hard-labeling performance and score information quantity in cancer and PBMC data sets. Scatterplots show balanced accuracy (x-axis) against score information quantity (y-axis) for various scoring method–data set combinations. Balanced accuracy quantifies hard-labeling performance; a score information quantity indicates the scores’ effectiveness in subtype classification. The diagonal line indicates perfect metric alignment, with vertical distances from this line representing scale imbalance. (E) Quantitative analysis of scale imbalance across scoring methods and tissue types (cancer and PBMC). The mean and standard deviation of scale imbalance for each method are shown. Scale imbalance is the absolute difference between score information quantity and balanced accuracy in direct label assignment. The method with the lowest mean scale imbalance, indicating optimal consistency between information content and labeling accuracy, is highlighted in bold. The intensity of the red background corresponds to the increase in scale imbalance. (F) Cell-state and cell-type annotation performance overview for all eight data sets and scoring methods.


