
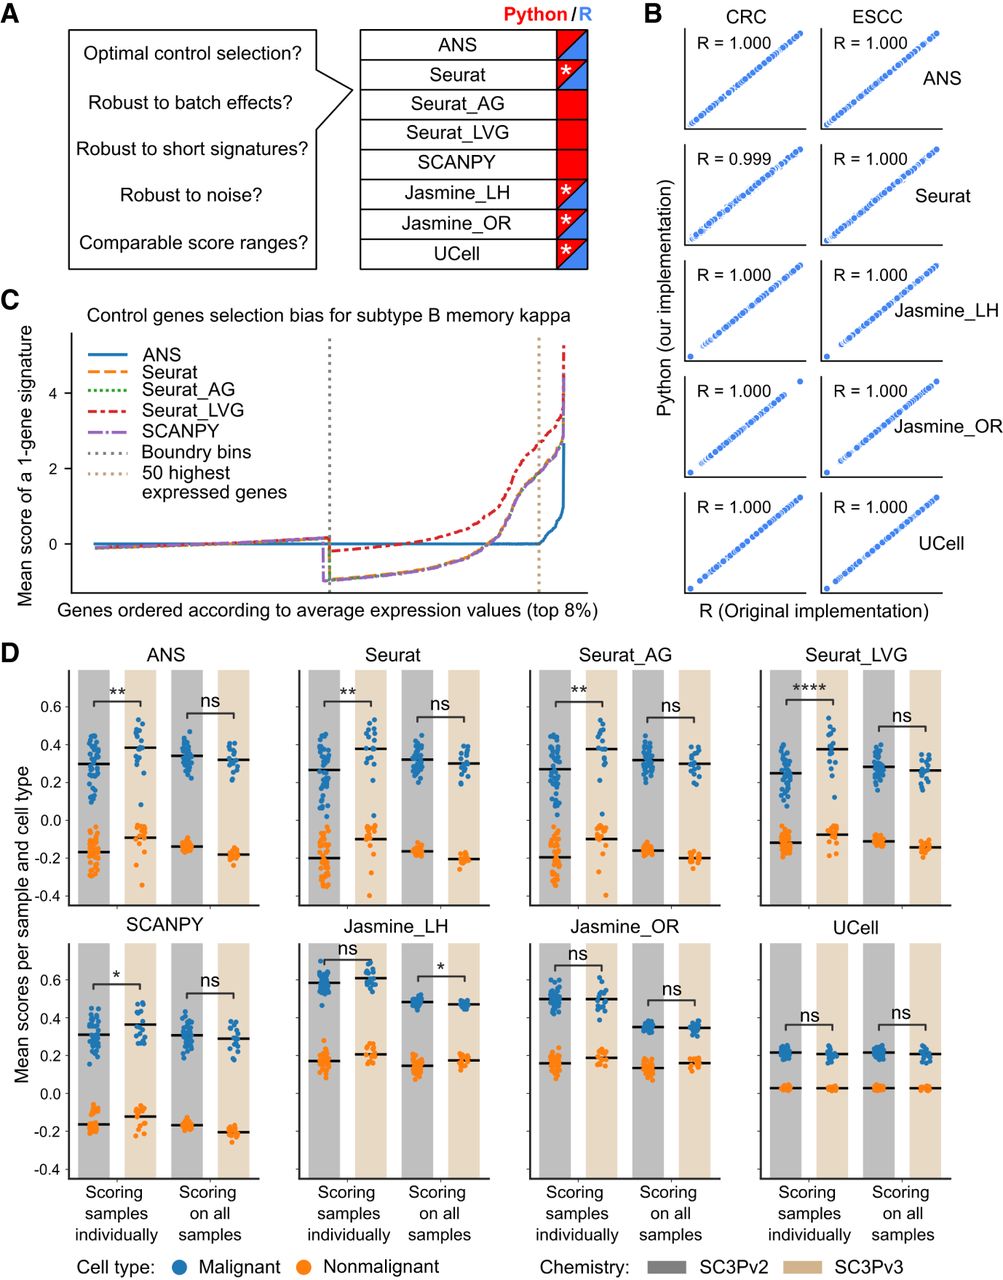
Performance and robustness analysis of gene signature scoring methods. (A) Benchmark questions for the gene signature scoring methods and availability of the methods in Python (blue) and R (red). Reimplementations of the original R packages in Python are indicated with a white asterisk. (B) The scores obtained from R and Python implementations compared for two cancer data sets (CRC, ESCC). Each subplot shows the Pearson correlation coefficient (R) between implementations. Discrepancies in Seurat scores between R (“AddModuleScore” of Seurat) and Python are attributed to randomization in the scoring method. (C) Control gene selection bias of the scoring methods for the top 8% of highly expressed genes in B memory kappa cells within the PBMC data set. The x-axis shows genes sorted by their average expression levels; the y-axis shows the mean score across all cells for a single-gene signature. Vertical dashed lines indicate the expression bin boundary and the top 50 highly expressed genes. The bias of a scoring method is indicated by how far the mean score of a gene deviates from zero. (D) The influence of data set composition and batch effect on scoring CRC cells using a 100-gene signature associated with malignant cells. Each dot represents the mean score for all cells within a sample, grouped by cell type (malignant in blue or nonmalignant in orange), sequencing chemistry type (SC3Pv2 in gray or SC3Pv3 in beige), and scoring mode (scoring all the samples together or individually). The black horizontal bar represents the mean value of all dots within each group. P-value annotation: (ns) P > 0.05, (*) 0.01 < P ≤ 0.05, (**) 1 × 10⁻³ < p ≤ 0.01, (***) 1 × 10⁻⁴ < p ≤ 1 × 10⁻³, (****) p ≤ 1 × 10⁻⁴.


