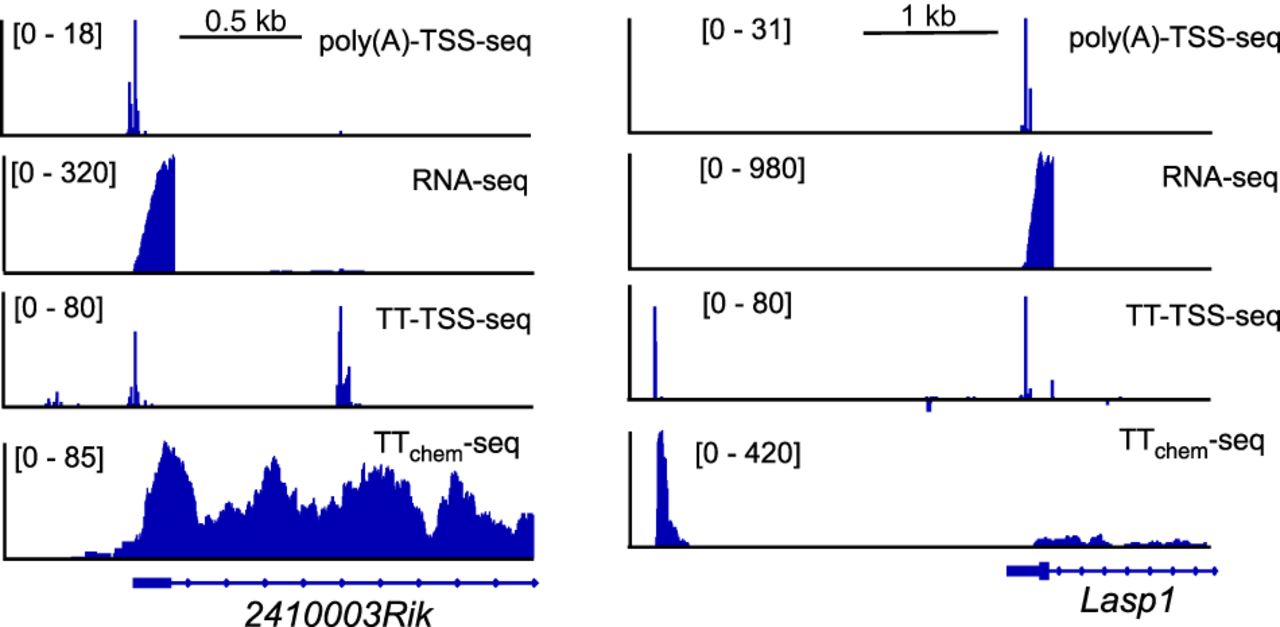
Mapping and quantifying nascent transcript start sites using TT-TSS-seq

(Downloading may take up to 30 seconds. If the slide opens in your browser, select File -> Save As to save it.)

Click on image to view larger version.

Figure 6.
Figure 6.

Example loci comparing TT-TSS-seq and poly(A)-TSS-seq. IGV showing example loci of TT-TSS-seq and poly(A)-TSS-seq in mESCs. Also included are TTchem-seq and RNA-seq for the same cell line and the same growth conditions. Scale is indicated on the top.

This Article

  1. Genome Res. 36: 600-610

Preprint Server