
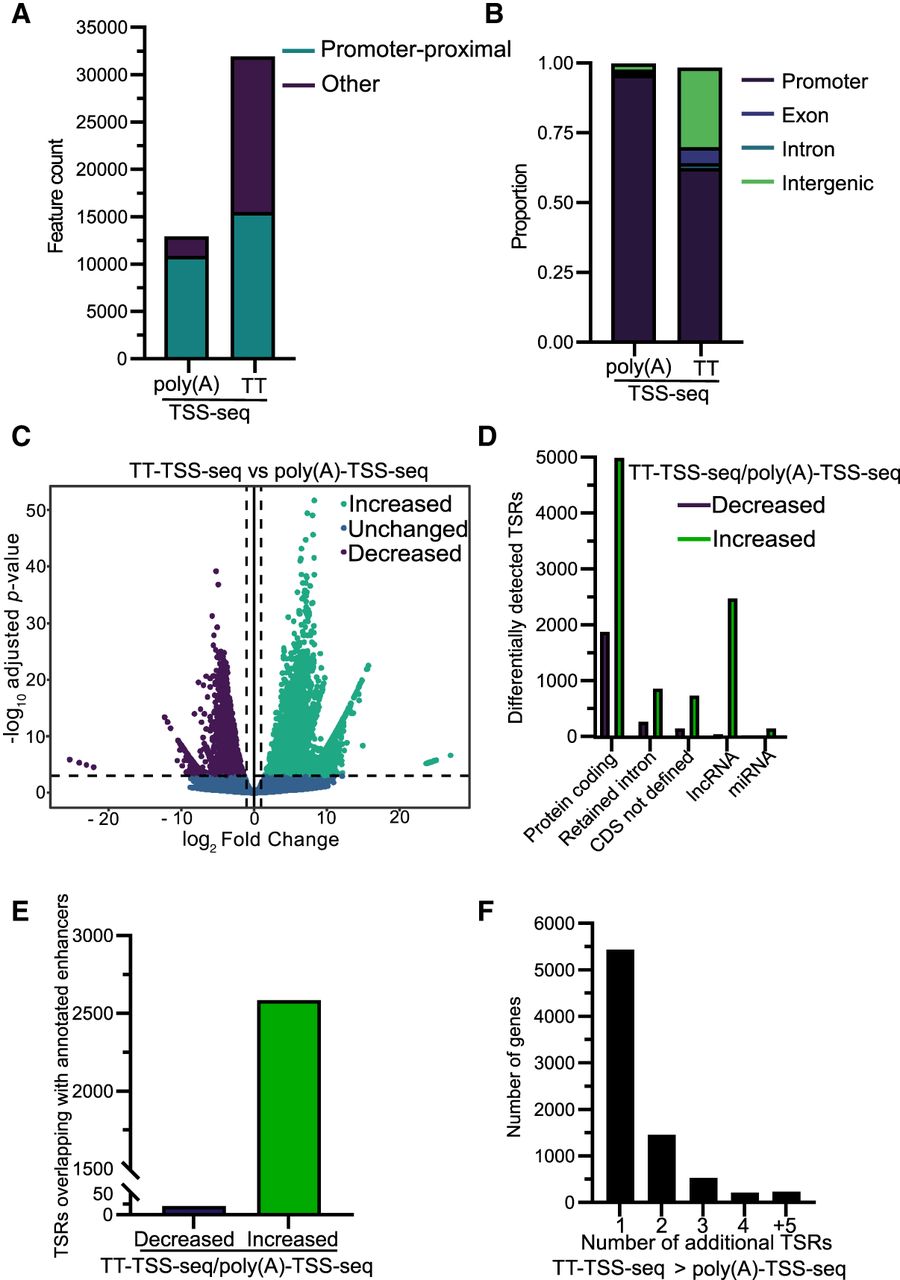
Comparing tags identified with poly(A)-TSS-seq and TT-TSS-seq. (A) Bar plot showing the number of transcripts with promoter-proximal TSRs. Normalized tags within 25 bp, and to a maximum distance of 250 bp, were merged to identify TSRs. (B) Bar graph showing the distribution of detected TSSs among genic regions; −500 to +500 bp from annotated TSSs was used to define the promoter-proximal region. UMI-based PCR duplicate removal was carried out during TSS-sequencing analysis. Tag counts were normalized using the DESeq2 median-of-ratios approach using a threshold of 3 counts. (C) Volcano plot showing the TSRs detected at significantly different levels when using nascent compared to steady-state RNA. Normalized TSSs, located within 25 bp and to a maximum distance of 250 bp, were grouped into TSRs, and differential analysis was carried out (using DESeq2 with a false discovery threshold of 0.001 and a fold-change threshold of 2). (D) Number of TSRs, differentially detected between TT-TSS-seq versus poly(A)-TSS-seq associated with different transcript types (as annotated by Ensembl). “Protein-coding transcripts” harbor ORFs, “CDS not defined” are alternatively spliced isoforms of protein-coding transcripts with no identified ORF, and “retained intron transcripts” are alternatively spliced isoforms that harbor an intron and are predicted to be noncoding. (E) Number of TSRs, differentially detected between TT-TSS-seq and poly(A)-TSS-seq that overlap with enhancer regions (as annotated by FANTOM5) (Noguchi et al. 2017). (F) The number of genes with additional TSRs detected with a significantly increased signal by TT-TSS-seq compared to poly(A)-TSS-seq. Genes with a single TSR detected in the poly(A)-TSS-seq, which did not show a significant difference in signal or exhibited an increase compared to TT-TSS-seq, were used for the analysis. The number of additional TSRs detected at significantly higher levels by TT-TSS-seq is displayed.


