
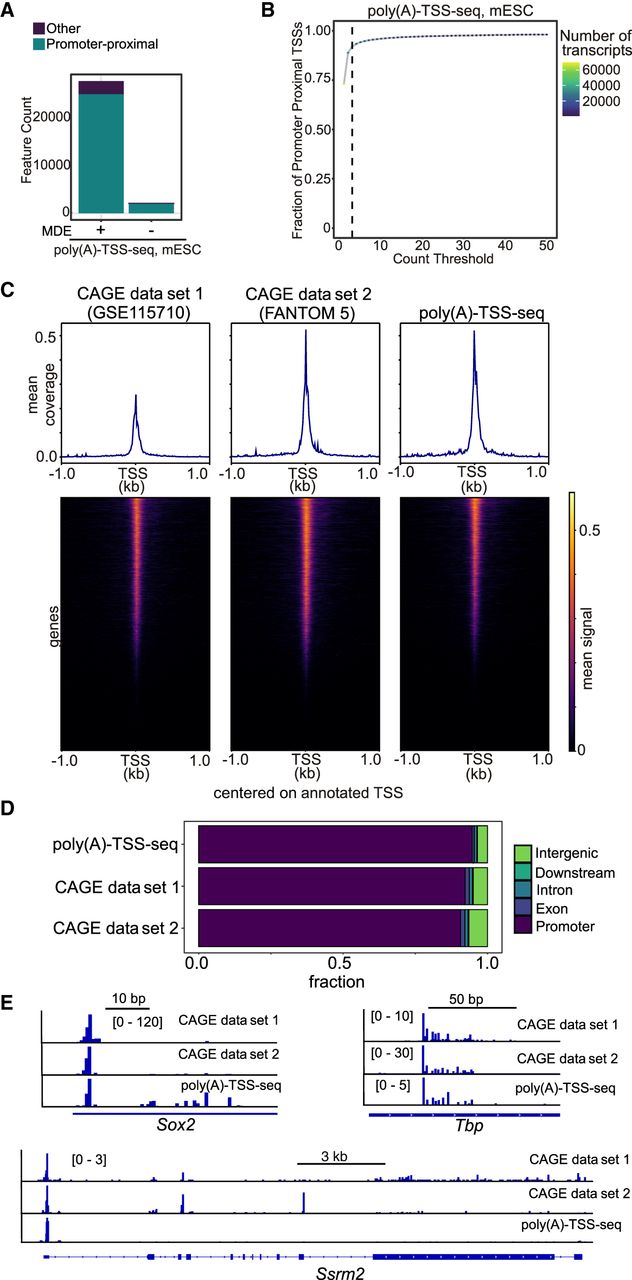
Poly(A)-TSS-seq protocol in mESCs and compared to CAGE. (A) Bar plot showing the number of transcripts with promoter-proximal tags in mESCs detected by poly(A)-TSS-seq (+MDE). As a negative control, a no-decapping reaction sample was included (−MDE). A threshold of n = 3 counts was applied. (B) Fraction of tags that are promoter-proximal (−500 to +500 bp from annotated TSSs) at different read count thresholds for mESC. A threshold of n = 3 read counts was used. (C) Density plots and heat maps showing tag locations detected with poly(A)-TSS-seq and two CAGE data sets using mESC RNA compared to annotated mouse TSSs. (D) Genomic locations of detected tags with poly(A)-TSS-seq and two CAGE data sets. (E) Example loci of poly(A)-TSS-seq and two CAGE data sets. Showing are Sox2, Tbp, and Ssrm2.


