
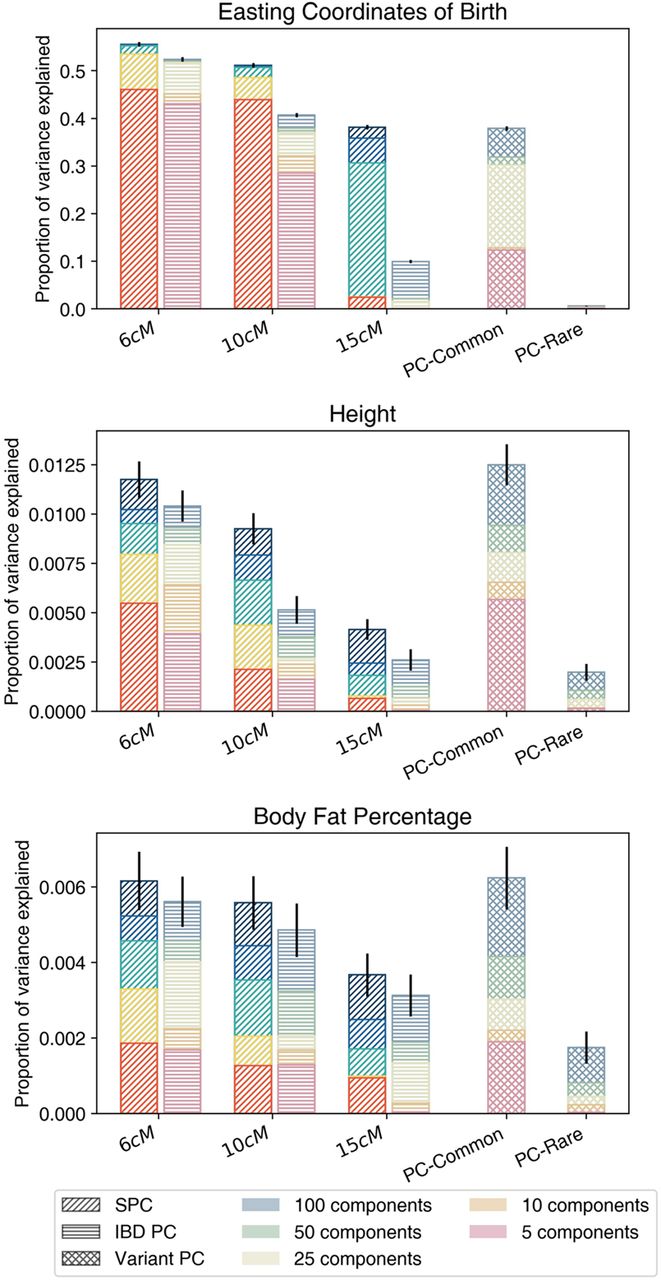
Bar plots of the PVE in eastings, height, and BFP explained by SPCs (derived from binary IBD relatedness), IBD PCs (derived from binary IBD relatedness), and PCs (derived from genetic variants) in the UK Biobank. Exploring the effects of a minimum IBD sharing parameter and decomposition approach on the performance of covariates. PCs of common and rare variants are displayed on the rightmost side of the figure. For other components, labels on the x-axis indicate the minimum IBD sharing threshold used to generate the components. Spectral (SPC) and principal (IBD PC) components were calculated per relatedness graph, indicated by diagonal and horizontal shading lines, respectively. SPCs are highlighted in brighter colors. PCs of common and rare variants are subscripted as PC-Common and PC-Rare, respectively.


