
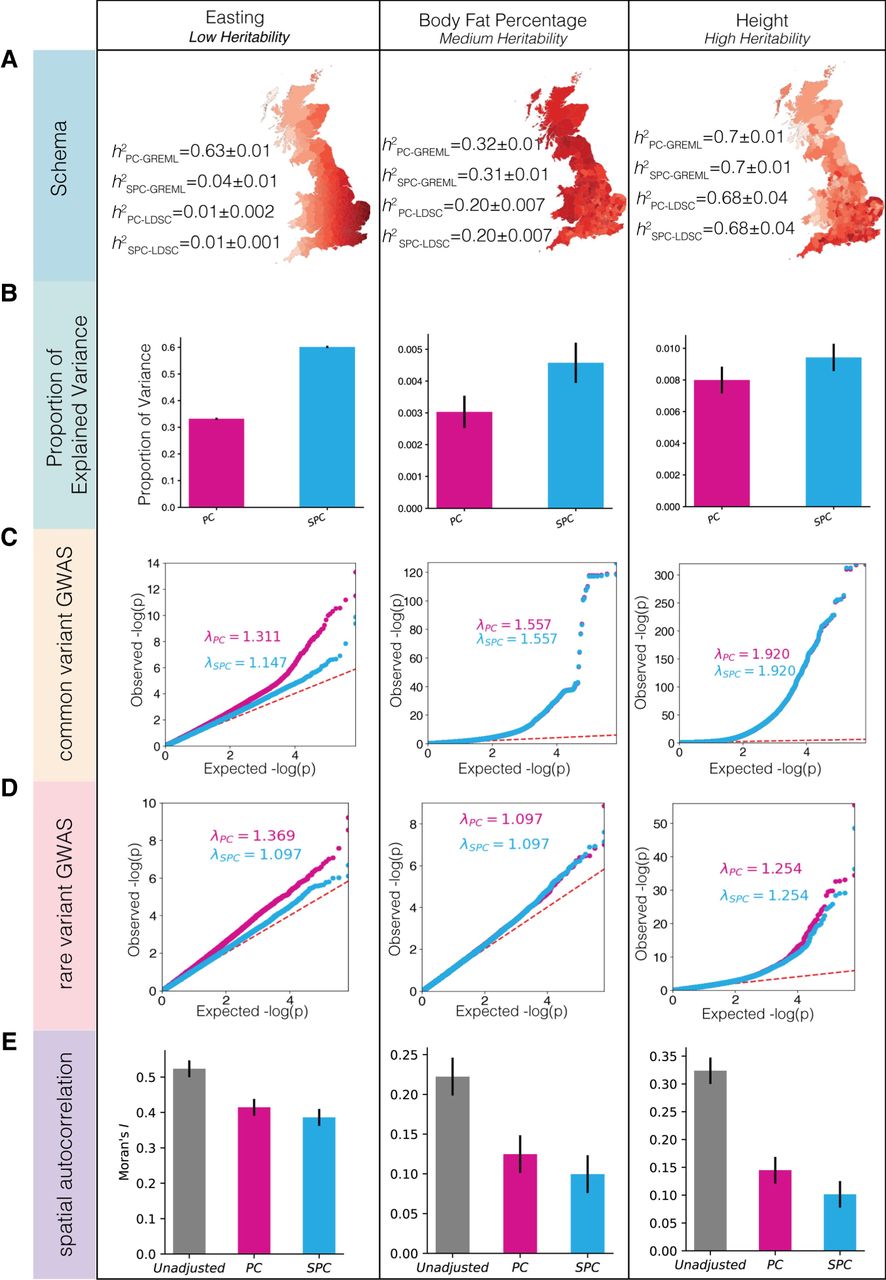
Comparison of PCs and SPCs as covariates to correct for the effects of population structure on the outcomes in the UK Biobank. (A) The structure of each phenotype. We analyzed three phenotypes with varying degrees of true heritability, increasing from left to right. Heritability estimation using GREML and LDSC methods, after correcting for recent population structure using both approaches, is shown, along with display of average phenotype values in each administrative county in the United Kingdom. (B) Proportion of explained variance in each phenotype by a model that only includes PCs or SPCs as covariates. Error bars represent standard deviation. (C) QQ plot of the distribution of P-values in the GWAS of common variants for each phenotype that measure the ability of covariates to adjust for the effects of recent population structure on the outcomes. (D) QQ plot of the distribution of P-values in the GWAS of rare variants (MAF < 1%) in the imputed data set. (E) Spatial autocorrelation of each phenotype measured in terms of Moran's I as a comparison of the ability of each set of covariates to correct against the artifacts of environmental effects.


