
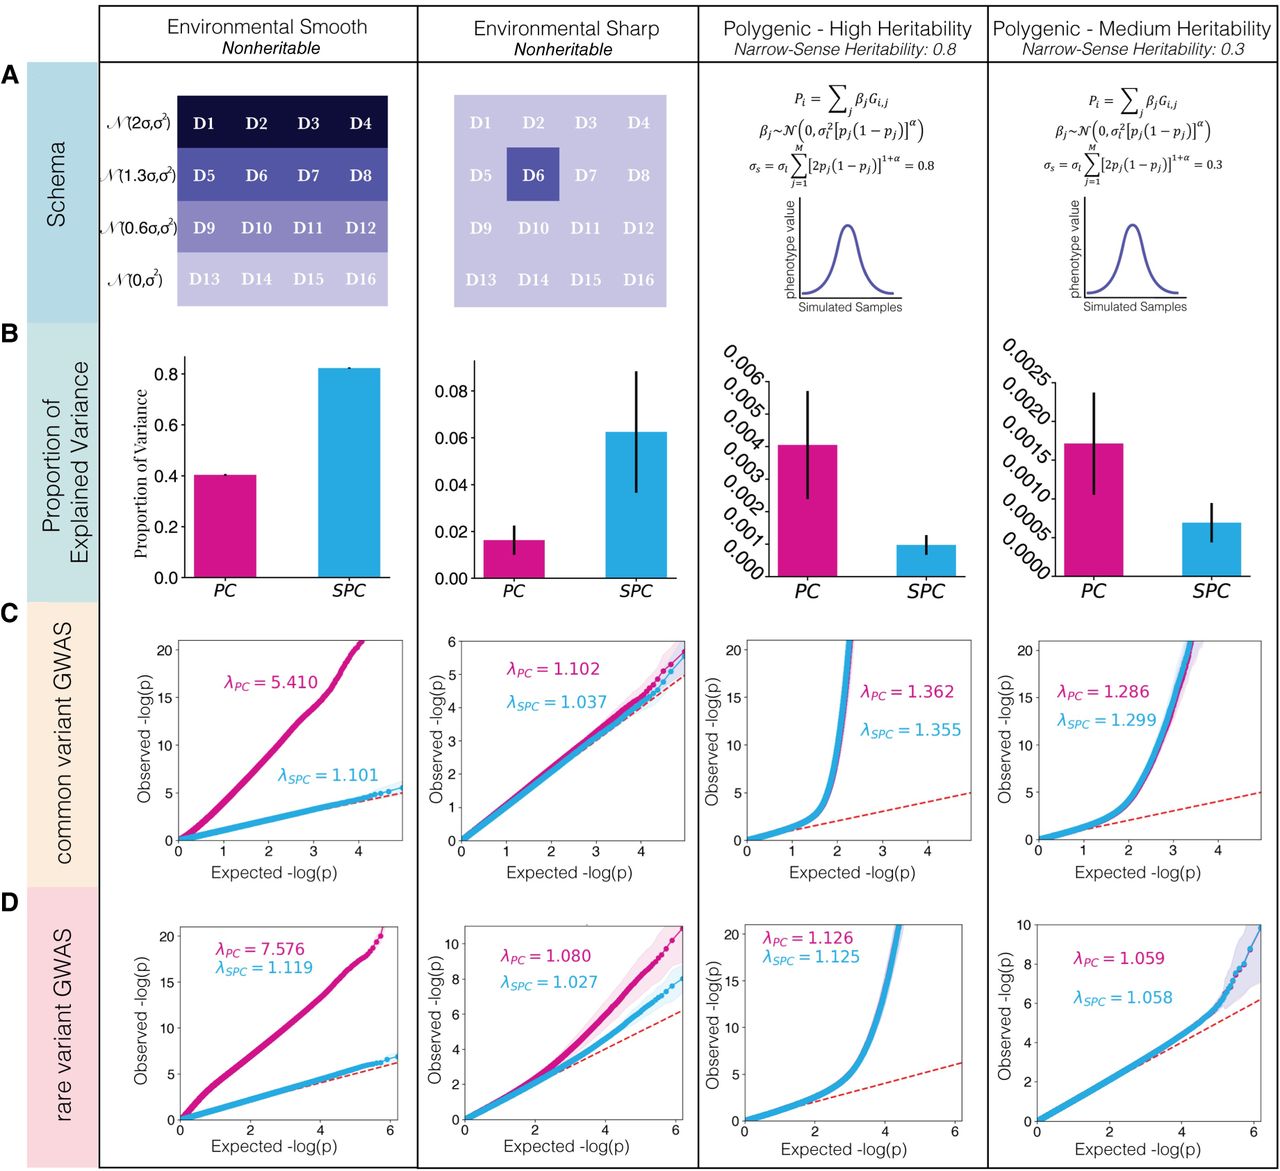
Comparison of PCs and SPCs as covariates to correct for the effects of population structure on the outcomes in simulations. (A) The schema of simulated phenotypes. First is the environmental smooth phenotype, in which the values are determined based on the vertical coordinate of origin for each individual. The phenotype values are drawn from a normal distribution with shared standard deviation. The mean of the distribution in each row is lower than the row above, resulting in a difference of twice the standard deviation between the top and the bottom row. Second, the environmental sharp phenotype is determined by the deme of origin. The phenotype values for all demes other than D6 are drawn from a zero-centered normal distribution, whereas in D6, phenotype values are drawn from a normal distribution with the mean set to twice the standard deviation. Finally, the two polygenic phenotypes were determined by assigning effect sizes to causal variants, randomly selected from windows of 10,000 bp, and calculating the polygenic score based on the effect sizes. Effect sizes were drawn from a random normal distribution with a mean of zero and a variance derived from minor allele frequency, heritability, and selective pressure. σs determines the expected heritability of the phenotype, whereas α determines the selective pressure, with negative values resulting in higher effect sizes assigned to variant with low minor allele frequency. Tested values for σs were 0.8 for the high heritability phenotype and 0.3 for the medium heritability phenotype. α was set to −0.5 across both experiments. (B) Proportion of variation in the phenotypes explained by the first 25 PCs and SPCs in four categories of simulated phenotypes. Adjustment methods are listed on the x-axes, and the y-axes represent proportion of variance explained by each model. The error bars represent the standard deviation. (C) Inflation of P-values in a GWAS analysis of simulated phenotypes using common variants only. (D) Inflation of P-values in a GWAS analysis of simulated phenotypes using rare variants (10 < MAC < 100).


