
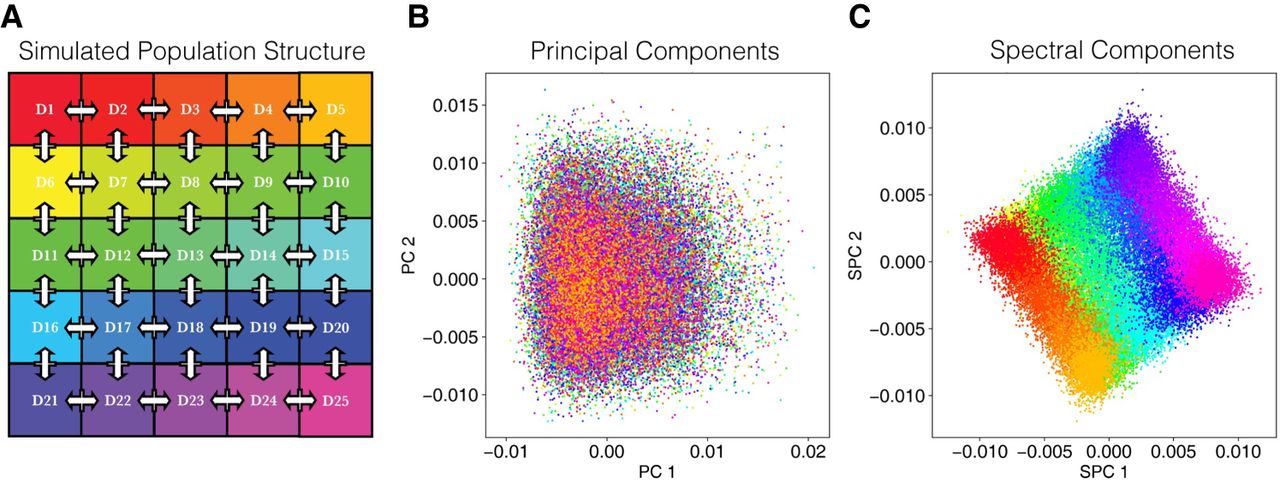
Reconstruction of recent population structure by covariates. (A) A schematic of our simulation of a cohort with homogeneous population structure with 25 demes and constant migration (5% per generation) between neighboring demes. All demes coalesce to single ancestral deme 200 generations ago. Consequently, simulated individuals have similar genetic backgrounds in terms of common variants, while simultaneously harboring distinct structure in terms of rare variation and environment of origin. (B,C) PC and SPC representation of the shared genetic ancestry among simulated samples. Dots in either panel represent samples colored based on the deme of origin.


