
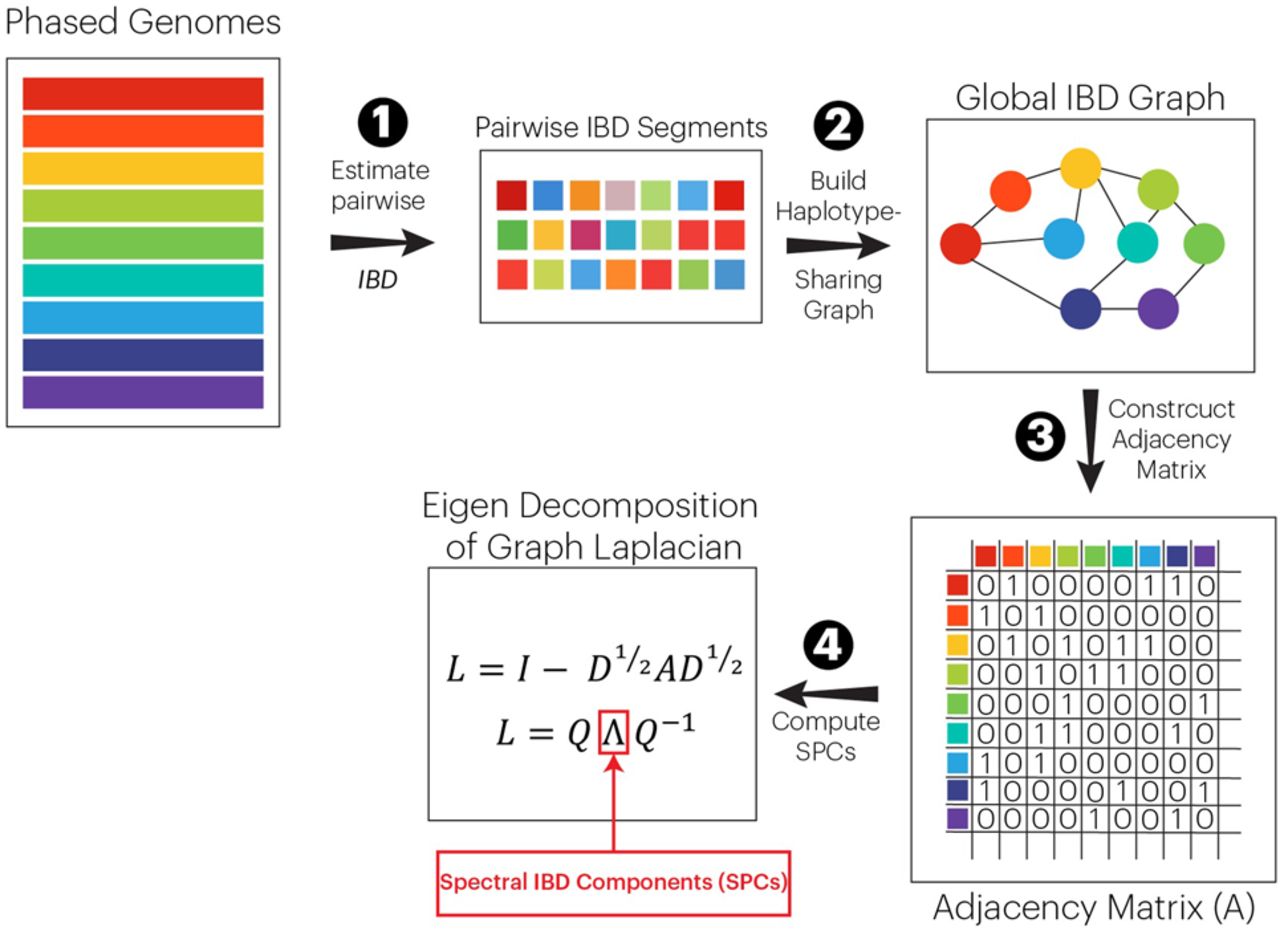
Figure 1.
General schema for calculating SPCs. First, phased genotypes are used to estimate segments of genome shared between individuals IBD. Second, the IBD segments are utilized to generate a relatedness graph with vertices representing participants and edges representing aggregated IBD sharing between pairs of participants above a threshold of 6 cM genome-wide. Third, the IBD relatedness graph is transformed into an adjacency matrix (A). Finally, the adjacency matrix A is transformed into its Laplacian form. The eigenvectors corresponding to the smallest eigenvalues of this matrix comprise the set of SPCs.


