
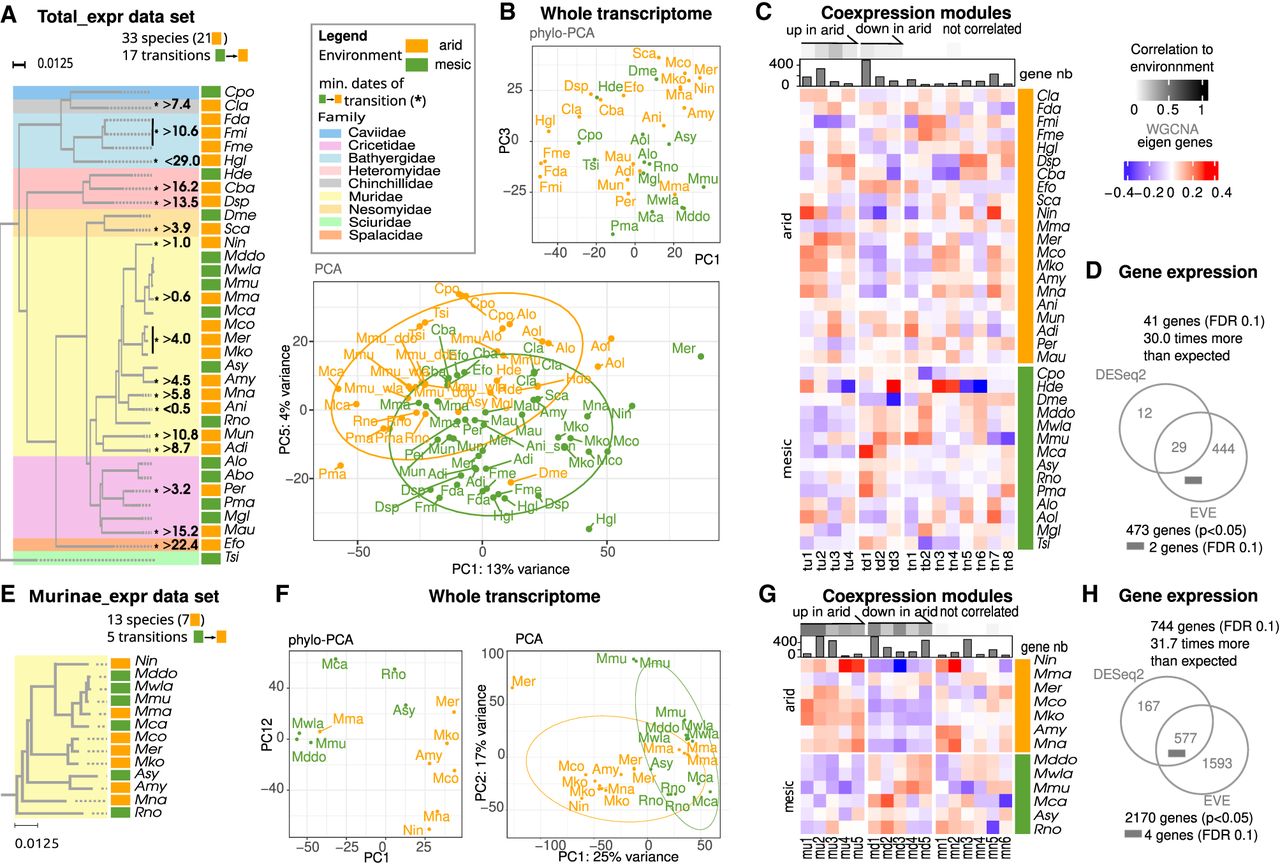
Detection of convergence in expression levels in rodents and in Murinae. (A–D) Detection in the Total_expr data set. (A) Phylogeny of species in the total expression data set. Species names are colored by environment (mesic: green; arid: orange). Rodent families are color-coded. Minimal dates of transitions to arid environments are indicated. (B) Whole transcriptome patterns extracted with a principal component analysis (PCA) made using batch-corrected expression values for 5443 genes and 80 individuals. PC1 is shown with PC5, because it is best correlated with the environment. Main patterns from a phylogenetic principal component analysis (Phylo-PCA); the components associated with most variance are represented. (C) Coexpression modules are represented by their eigen gene with the color showing expression levels in each species. Modules significantly down- or upregulated in arid species are depicted at the top of the panel, with grayscale colors indicating the strength of the correlation. Modules are named according to the sign and significance of this correlation and a number (tu: Total up; td: Total down; tn: Total not correlated). Barplots represent the numbers of genes in each module. (D). Venn diagram of differentially expressed genes found with DESeq2 and EVEmodel. The position of genes passing the EVEmodel FDR threshold is shown with a small bar. (E–H) Results for the Murinae expression data set. (E–G) Detection in the Murinae data set, for 7779 genes and 29 individuals. Colors as in A, and legend as in B–D. (mu) Murinae up, (md) Murinae down, (mn) Murinae not correlated. Code for species names in Figure 2.


