
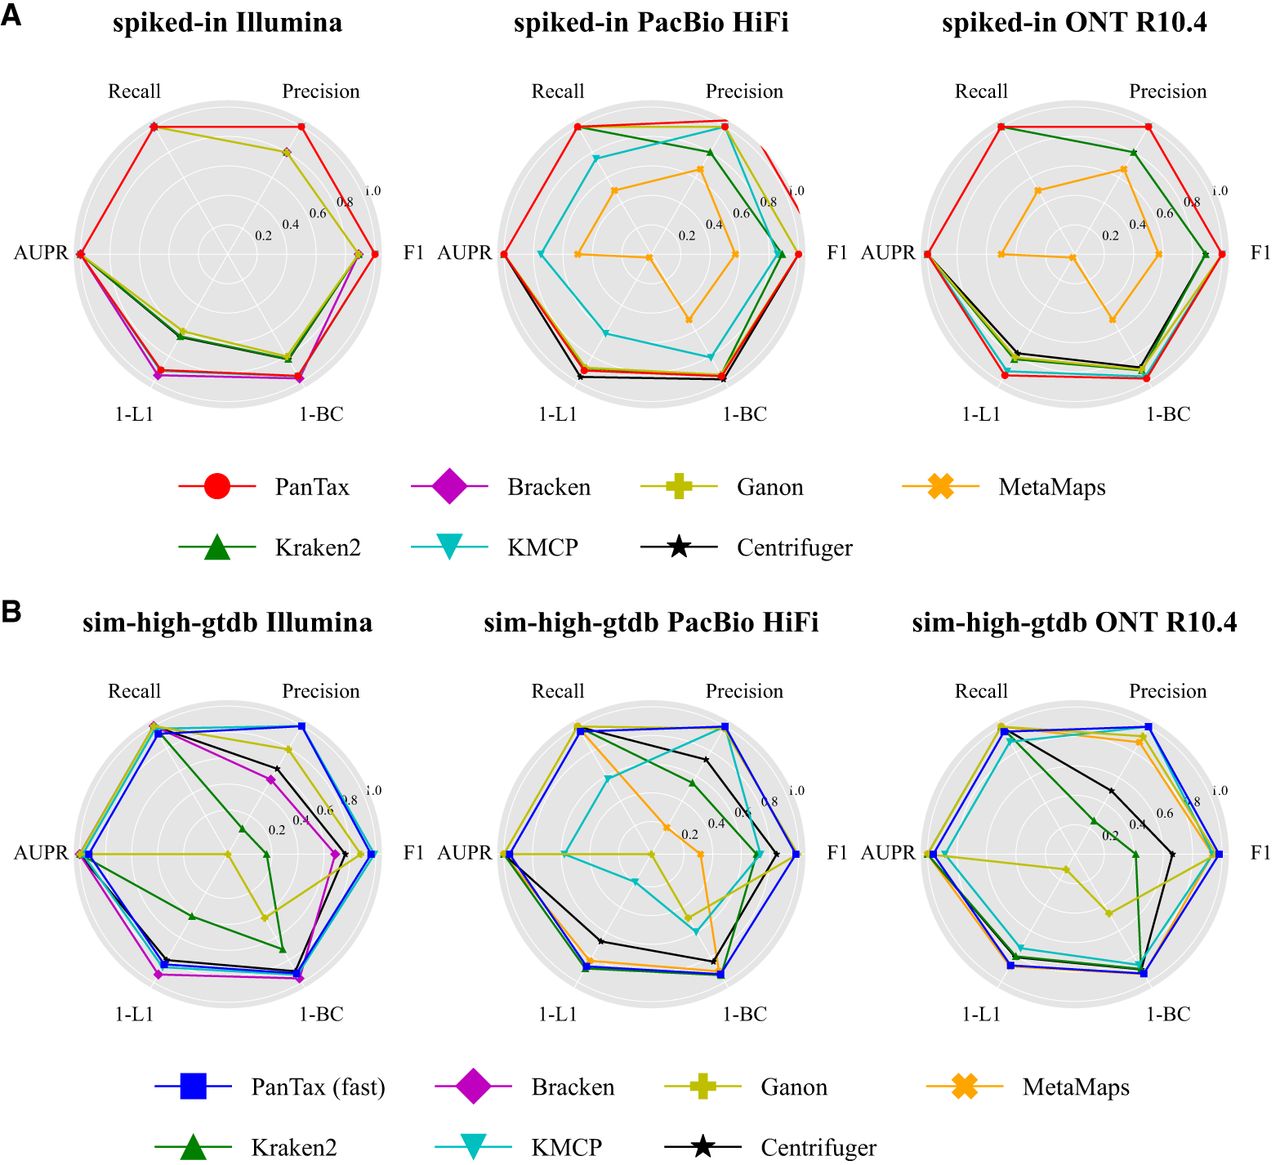
Figure 4.
Benchmarking results of strain-level taxonomic profiling. (A) Profiling for spiked-in data sets. (B) Profiling for simulated data sets (sim-high-gtdb) using the GTDB reference database. To visualize all metrics consistently (i.e., with higher values indicating better performance), we present the 1-L1 distance and 1-BC distance. (AUPR) Area under the precision-recall curve.


