
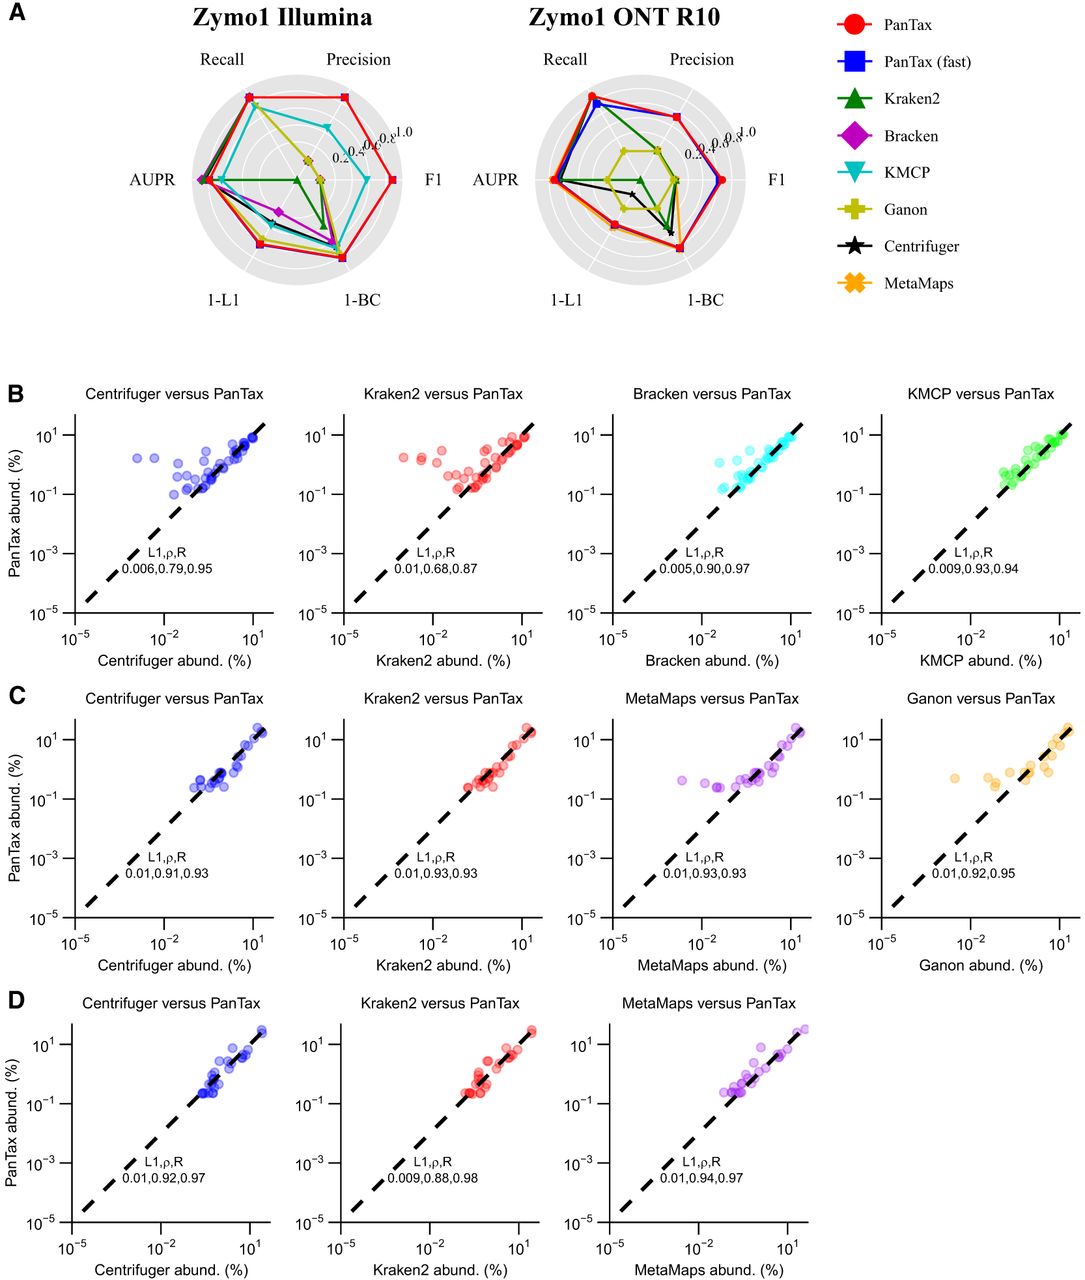
Strain-level taxonomic profiling across multiple species in real data sets. (A) Performance on the Zymo1 mock community. To visualize all metrics consistently (i.e., with higher values indicating better performance), we present the 1-L1 distance and 1-BC distance. (B–D) Performance on real human gut metagenomes: PD human gut (Illumina), omnivorous human gut (PacBio HiFi), and healthy human gut (ONT). For all three data sets, the relative taxon abundance correlation between PanTax and other competitive profilers was computed. The comparisons included mean L1 distance, Spearman's correlation, and Pearson's correlation. Note that we failed to run Ganon and KMCP on the healthy human gut (ONT) data set because it was primarily designed for short reads. (AUPR) Area under the precision-recall curve.


