
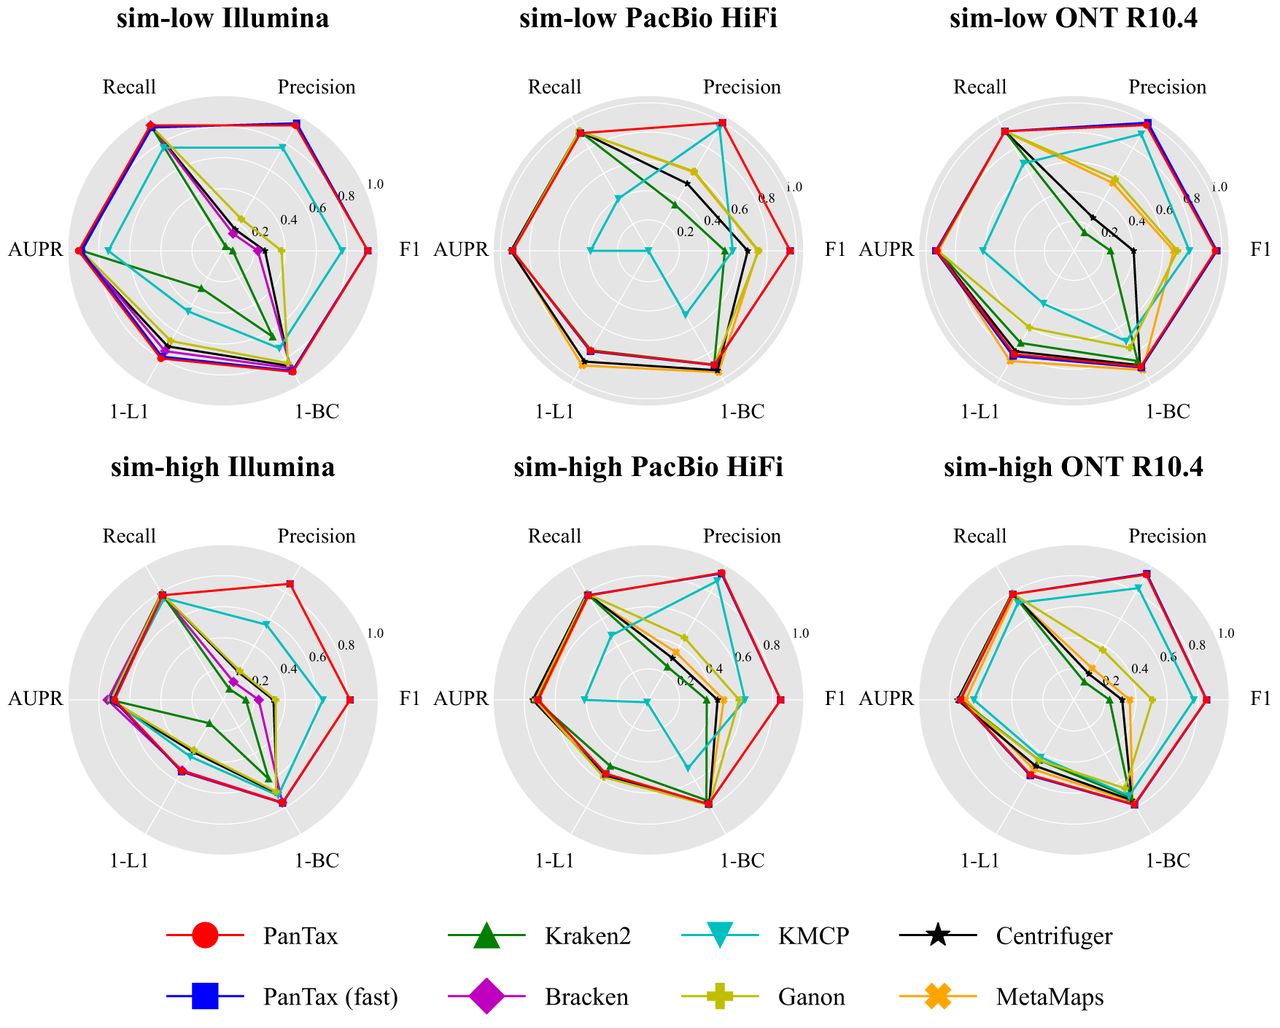
Figure 2.
Benchmarking results of strain-level taxonomic profiling on the simulated data sets (sim-low and sim-high). The upper and lower panels display the sim-low and sim-high data sets, respectively, for each of the three sequencing read types. To visualize all metrics consistently (i.e., with higher values indicating better performance), we present the 1-L1 distance and 1-BC distance. (AUPR) Area under the precision-recall curve.


