
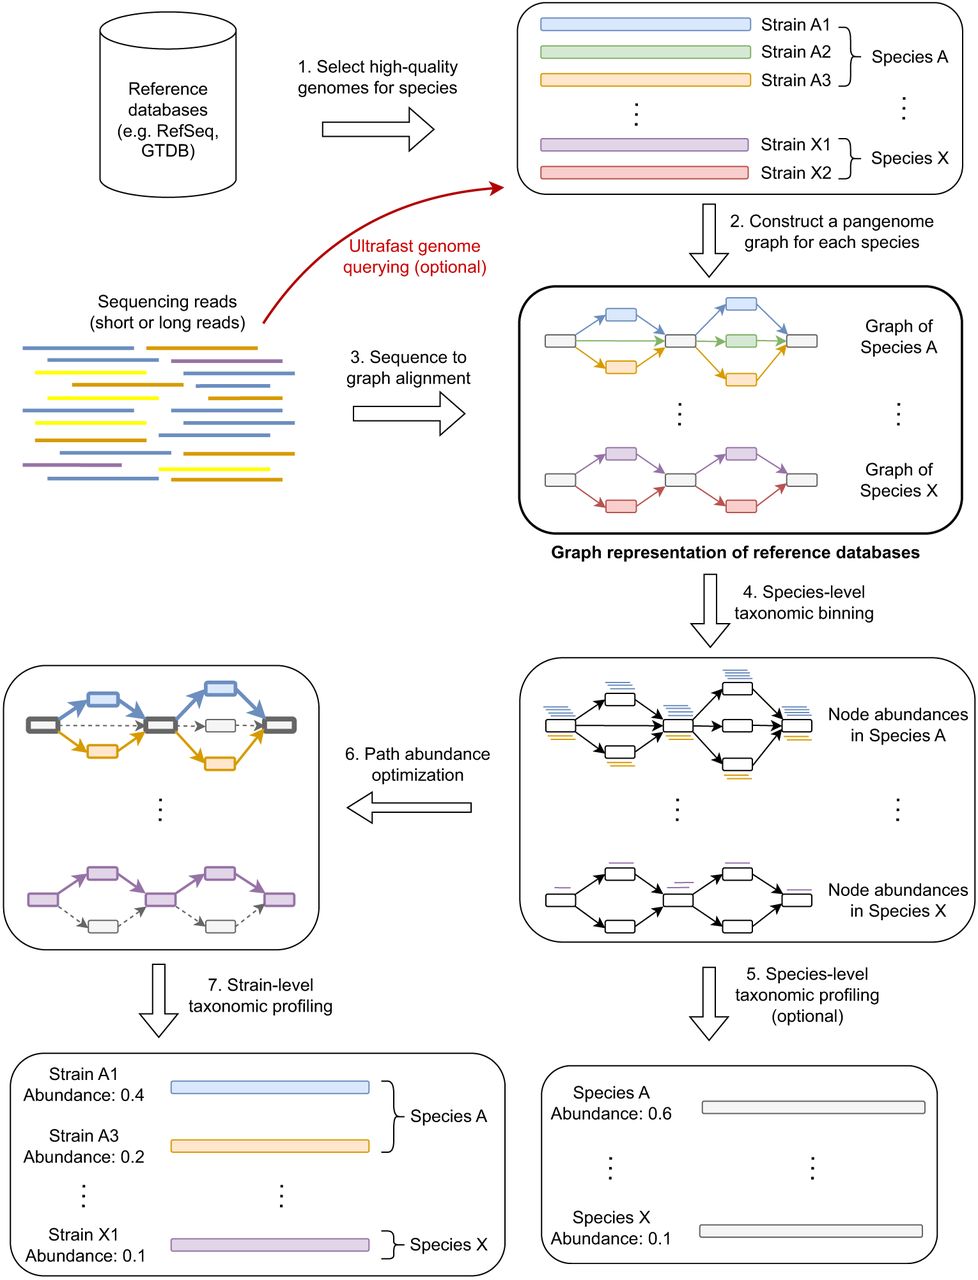
Workflow of PanTax. Different colors indicate different strains. The gray and colored rectangles in the pangenome graphs indicate the shared and unique genomic segments among strains, respectively. Arrows with the same color spell the path of a strain. The bold paths and dashed paths in the pangenome graphs indicate the existent and nonexistent strains in a sample, respectively. For simplicity, only two species (A and X) are shown in the figure. Note that Step 5 is optional unless one requires to output the species-level taxonomic profile. The “ultrafast genome querying” step (see Methods for details) marked with the red arrow and red text indicate the optional way to proceed when running the accelerated version of PanTax (= PanTax (fast)).


