
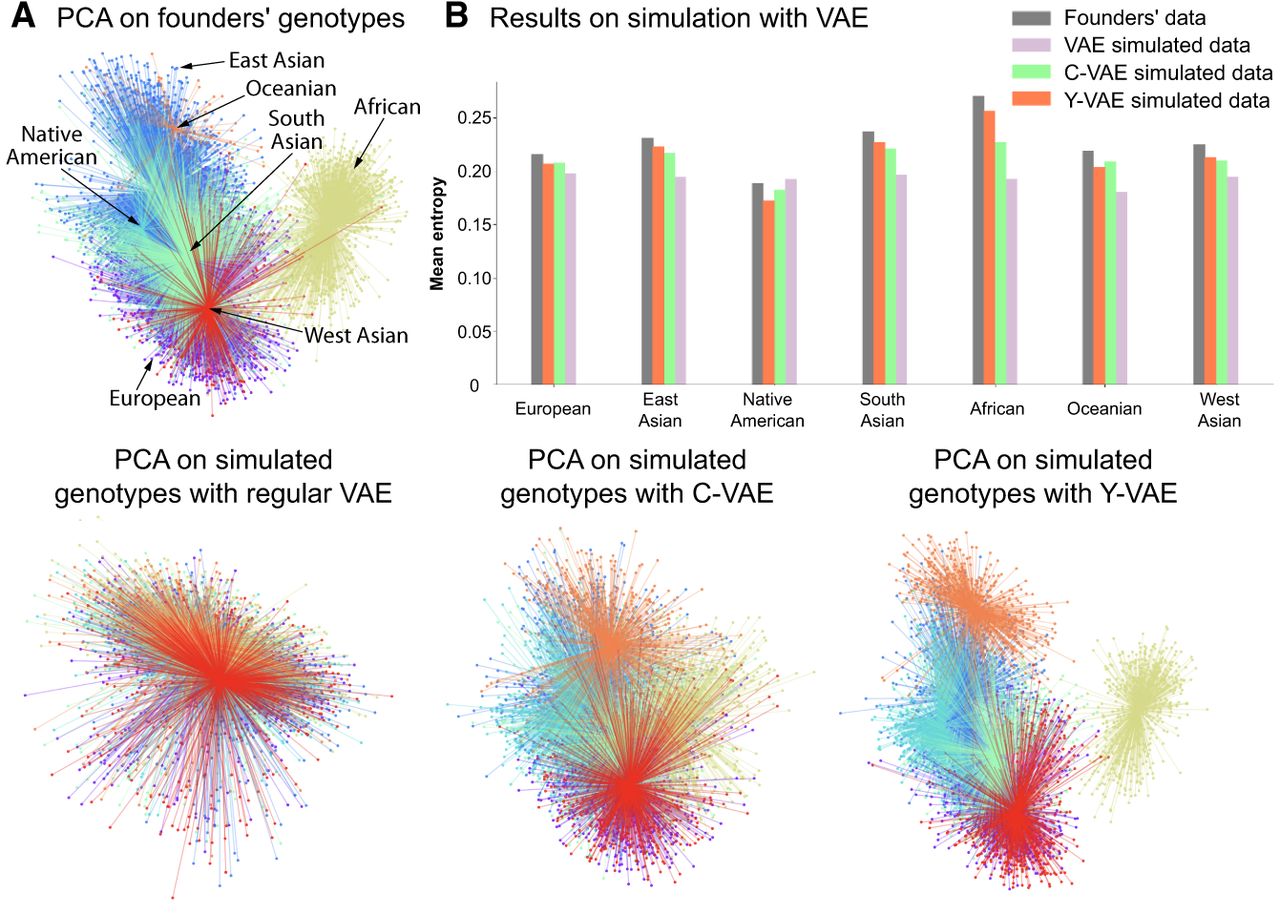
Figure 6.
PCA of simulated genotypes and entropy comparison. The number of simulated samples is equal to the number of founders. (A) The top-left plots display the PCA projection of founders’ genotypes. The plots at the bottom line display PCA projections of synthetic genotypes simulated with regular VAE, C-VAE, and Y-VAE, in that order. (B) The method that best approximates the entropy distribution is Y-VAE. The least effective method is without conditioning, because the entropy is approximately the same across all populations.


