
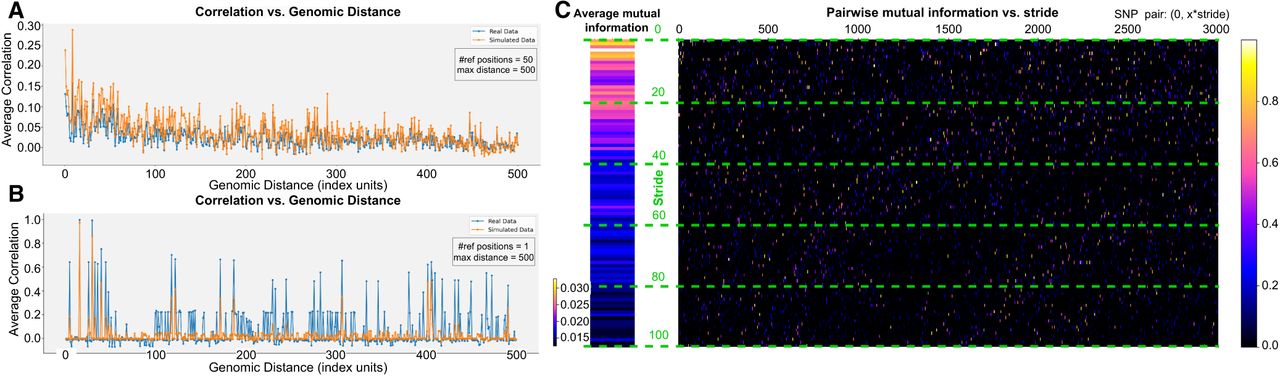
Metrics for assessing LD structure and inter-SNP correlation. (A) Average correlation versus genomic distance for real (blue) and simulated (orange) genotypes. We select multiple reference SNPs and plot the correlation with neighboring positions up to specified maximum distances (in the example, we use a distance of 500 with 50 reference positions). (B) Correlation of a single SNP position, illustrating how well the synthetic data reproduce the LD structure. (C) Pairwise mutual information between a reference SNP and other SNPs (x-axis) separated by varying stride lengths (y-axis), so that the resulting value corresponds to the SNP pair (0, x · y). The color scale indicates the magnitude of mutual information, from negligible (dark) to higher (bright) values.


