
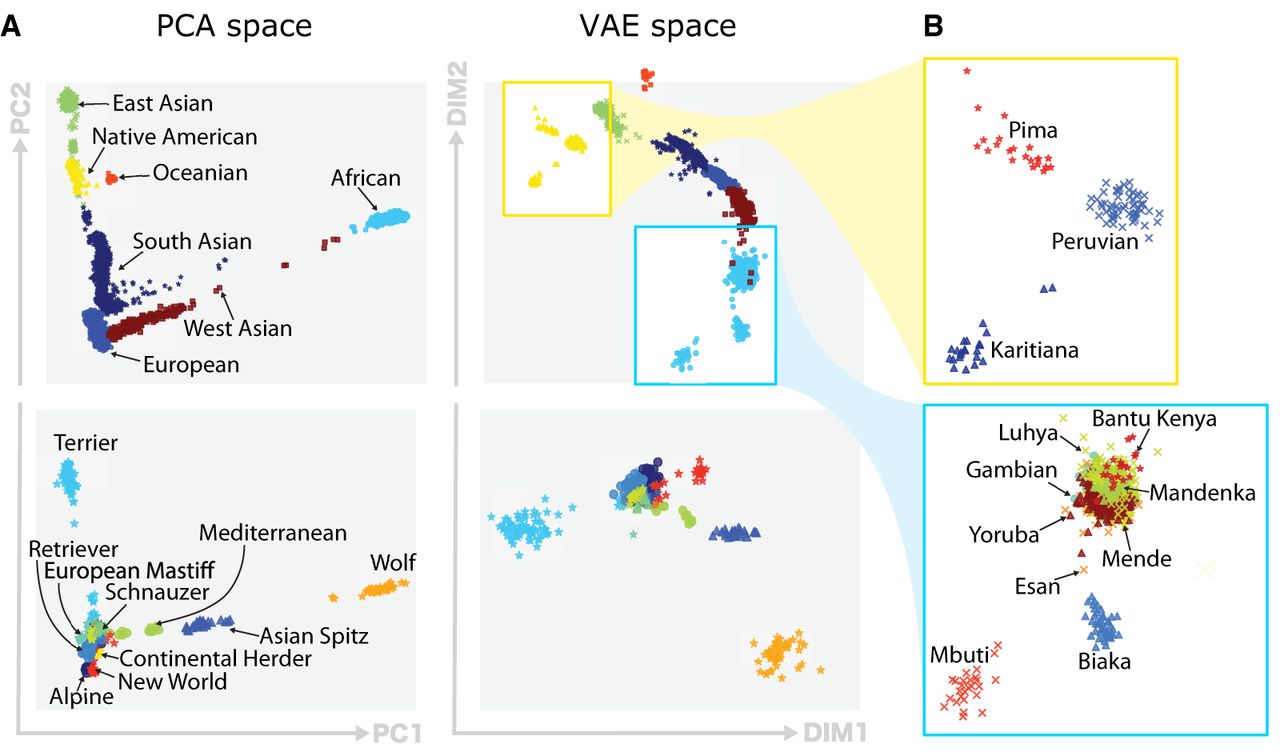
Figure 4.
Qualitative comparison of PCA and VAE projections. (A) The top row illustrates the projections generated by both PCA and VAE for 4894 human samples using 839,629 SNPs. The second row displays projections of 489 canine samples using 198,473 SNP positions. (B) Focus of VAE projections of Native American-like subpopulations (in yellow) and African subpopulations (in blue).


