
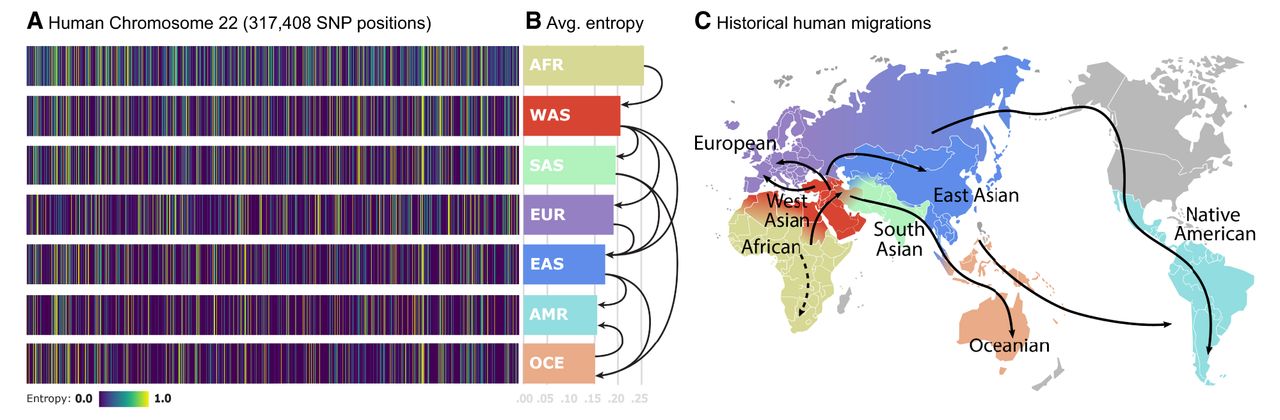
Figure 1.
SNP entropy variation between populations. (A) We find 317,408 SNP entropies computed for human Chromosome 22 for each continental population. Observe that the uncertainty levels for particular SNP positions are different for each population. This is directly related to genetic variability. (B) Average of entropy vectors from A. Those values would correspond to estimated lower bounds of compression for each human population. Arrows represent the migration paths. (C) World map showing the main directions of human population migrations.


