
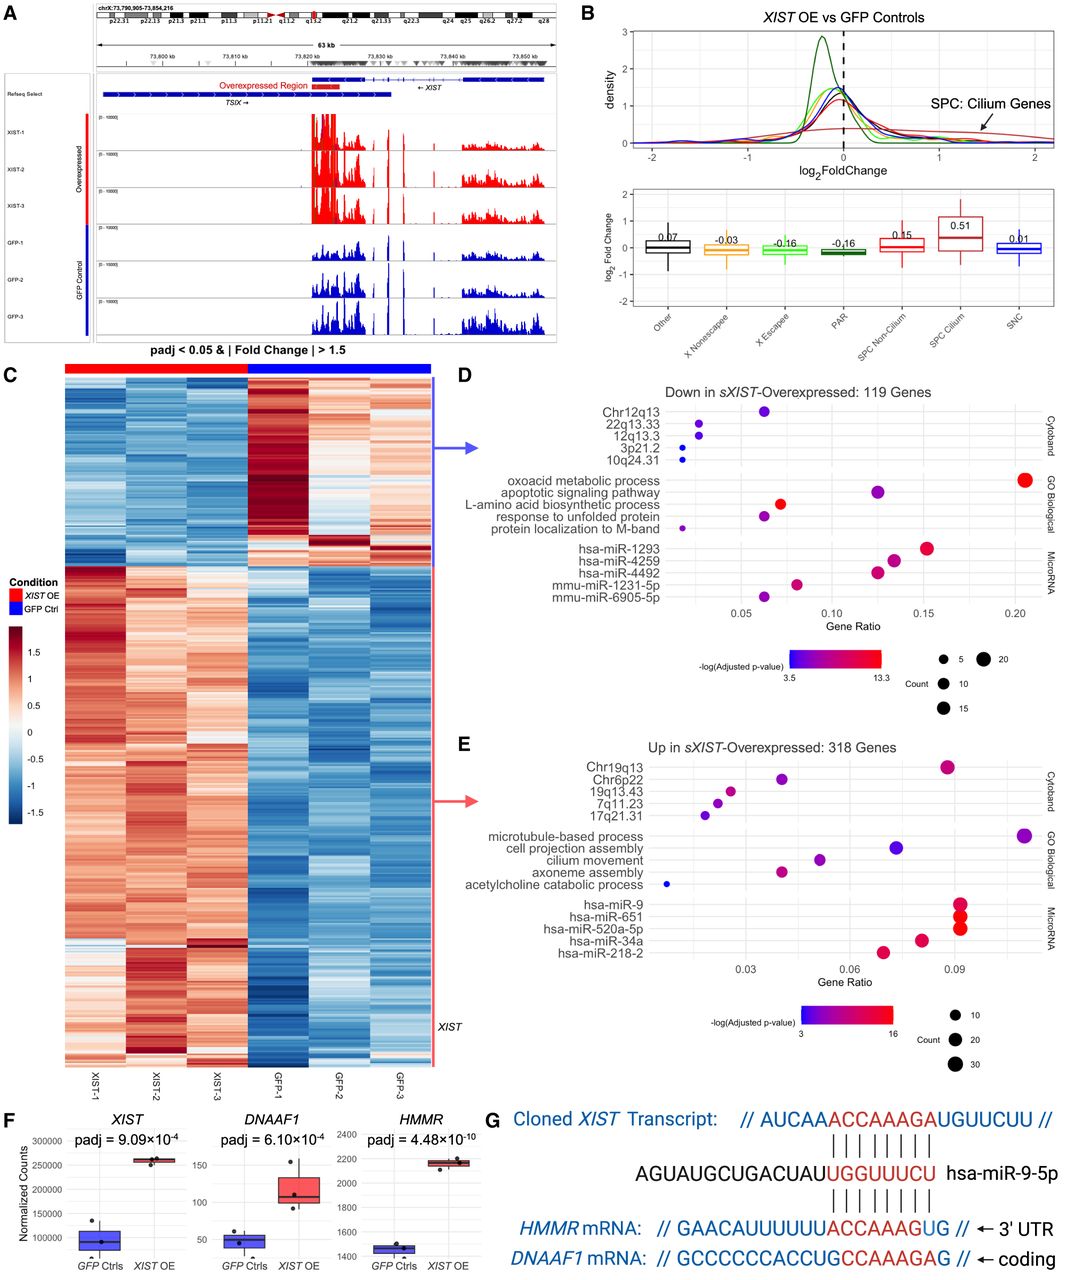
Figure 5.
RNA-seq analysis of sXIST overexpression. (A) IGV tracks showing RNA-seq reads over Chr X: 73,790,905–73,854,216, with TSIX and XIST indicated. Samples overexpressing the second half of exon 6 (XIST OE) are shown in red, and GFP controls (Ctrl) are in blue. (B) Density and boxplots showing log2FC values across gene groups. Values above boxplots are the mean log2FC for that group. (C) Heatmap of the DEGs (adjusted P-values < 0.05 and |fold change| > 1.5). (D,E) ToppFun results from downregulated (D) and upregulated (E) genes in C. (F) Boxplots showing the expression of XIST, DNAAF1, and HMMR. (G) Cloned XIST, DNAAF1, and HMMR transcript sequence alignments with hsa-miR-9-5p.


