
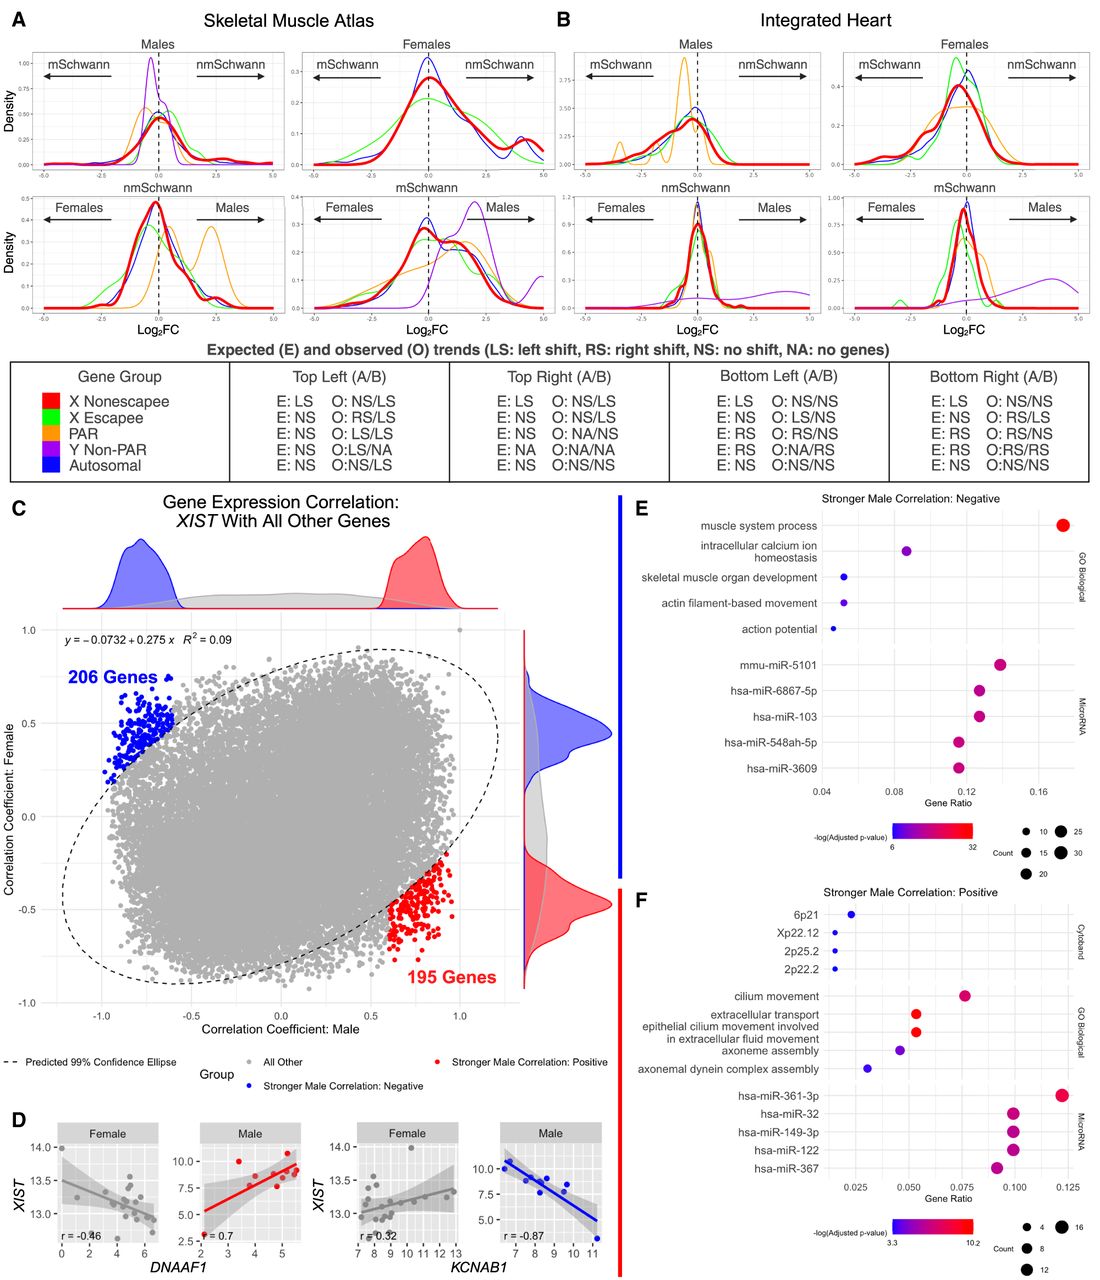
Potential roles of XIST in peripheral nerve. (A,B) Density plots of log2FC from a variety of gene group comparisons using human skeletal muscle data (A) and human heart data (B) along with their expected and observed trends. For X Chromosome nonescapee genes, the expected trend is based on the presumption that sXIST participates in XCI. In all comparisons, the log2FC values were computed from log2(sample-on-right/sample-on-left). Gene groups with too few genes for robust density analysis in a comparison were not included in these plots. Expected and observed trends for A and B are summarized at the bottom. (C) Pearson correlation coefficients (r) between XIST and all other genes computed separately for males (x-axis) and females (y-axis) using peripheral nerve bulk RNA-seq data. In this plot, each dot is a gene, and the predicted 99% confidence ellipse was overlayed (refer to Supplemental Fig. S12). Outlier genes with a male Pearson's correlation P-value < 0.05 and absolute difference >0.3 between male and female correlation coefficients were colored red if male r > 0 and blue if male r < 0. (D) Two gene examples (DNAAF1 and KCNAB1) exhibiting stronger positive (red) and negative (blue) expression correlation with XIST in males. Expression values are provided as log2(DESeq2-normalized counts + 1). (E,F) Overrepresentation analysis for genes with stronger negative male correlations (E) or stronger positive male correlations (F). Dot size represents the number of query genes in each term, and color is −log(FDR-adjusted P-value).


