
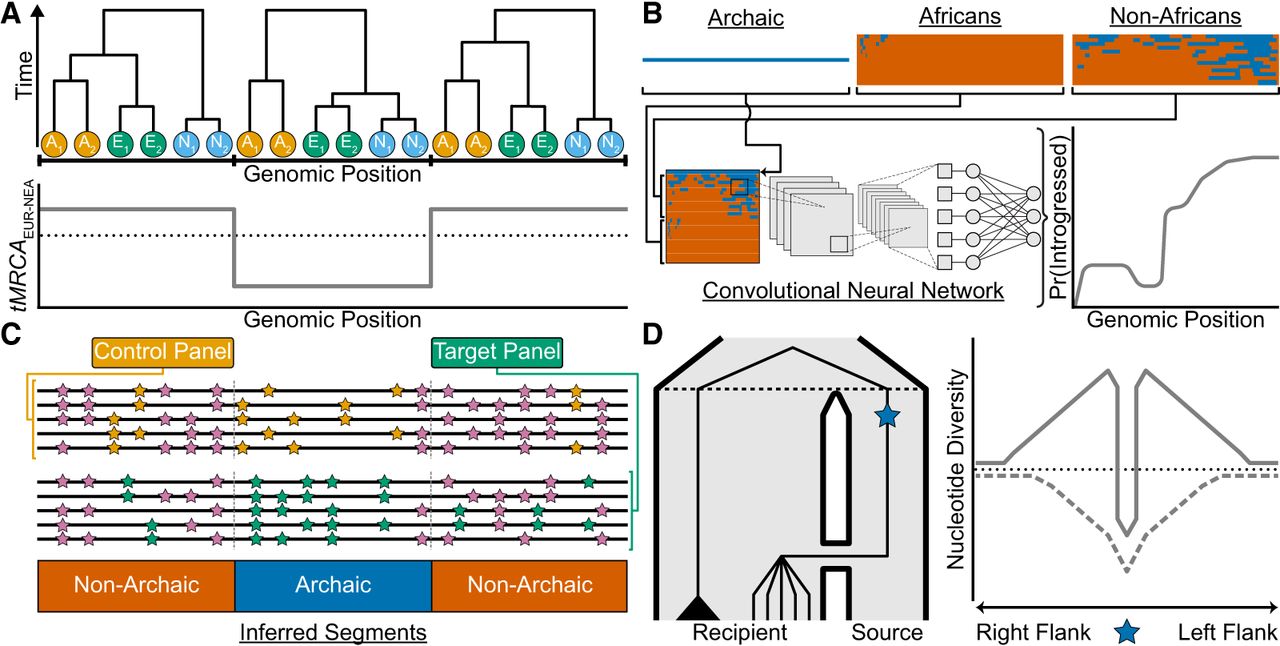
Recent approaches for studying introgression. (A) A hypothetical ancestral recombination graph (ARG) represented as a sequence of three local trees for two African chromosomes in orange (A1/A2), two Eurasian chromosomes in green (E1/E2), and two Neanderthal chromosomes in sky blue (N1/N2). One way to identify introgressed segments from the ARG is to look for local trees where lineages from the recipient and donor populations share a more recent common ancestor than expected, given their known split times. The plot shows the time to the most recent common ancestor (tMRCA) for Eurasian (EUR) and Neanderthal (NEA) chromosomes across the genome (gray line), with the black dotted line indicating their split time. Local trees with a tMRCA younger than this split time (e.g., the middle tree) can be interpreted as evidence of introgression. (B) Reference-based approaches leveraging convolutional neural networks (CNNs) applied to haplotype matrices. The top row depicts an archaic haplotype (blue) alongside haplotype matrices for African and non-African populations, with haplotypes sorted according to their similarity to the archaic haplotype. The combined haplotype matrix (bottom row) is processed by a CNN trained on simulated data, which outputs the probability of introgression in the non-African population for each position (gray line). (C) Reference-free methods do not rely on an archaic reference genome to infer introgressed segments. Instead, they use a control panel with negligible introgressed ancestry (e.g., Africans) and a target panel hypothesized to have received introgression (e.g., non-Africans). The genome is partitioned into windows (gray dashed lines). Within each window, these methods compare the local density of shared mutations (pink) to private mutations; orange and green for the control and target panels, respectively. Segments classified as “Archaic” exhibit a high density of private mutations in the target panel and a low density of shared mutations between the control and target panels. (D) A population tree (left) depicts gene flow from a source to a recipient population, with the black dashed line denoting their split time. A beneficial mutation (blue star) originates in the source population and is introgressed into the recipient population. In the recipient population, lineages carrying the beneficial mutation coalesce rapidly with the source lineage, forming a star-like topology, whereas the black triangle represents a clade of lineages that did not inherit the beneficial allele. The right panel depicts patterns of nucleotide diversity (y-axis) in the recipient population centered on the beneficial mutation (x-axis), with the black dotted line showing the genome-wide average. Under adaptive introgression (solid gray line), a narrow region of reduced diversity flanked by elevated diversity forms a volcano pattern, contrasting with a classical selective sweep (dashed gray line), where the beneficial mutation arises within the recipient population, creates a broader valley of reduced diversity.


