
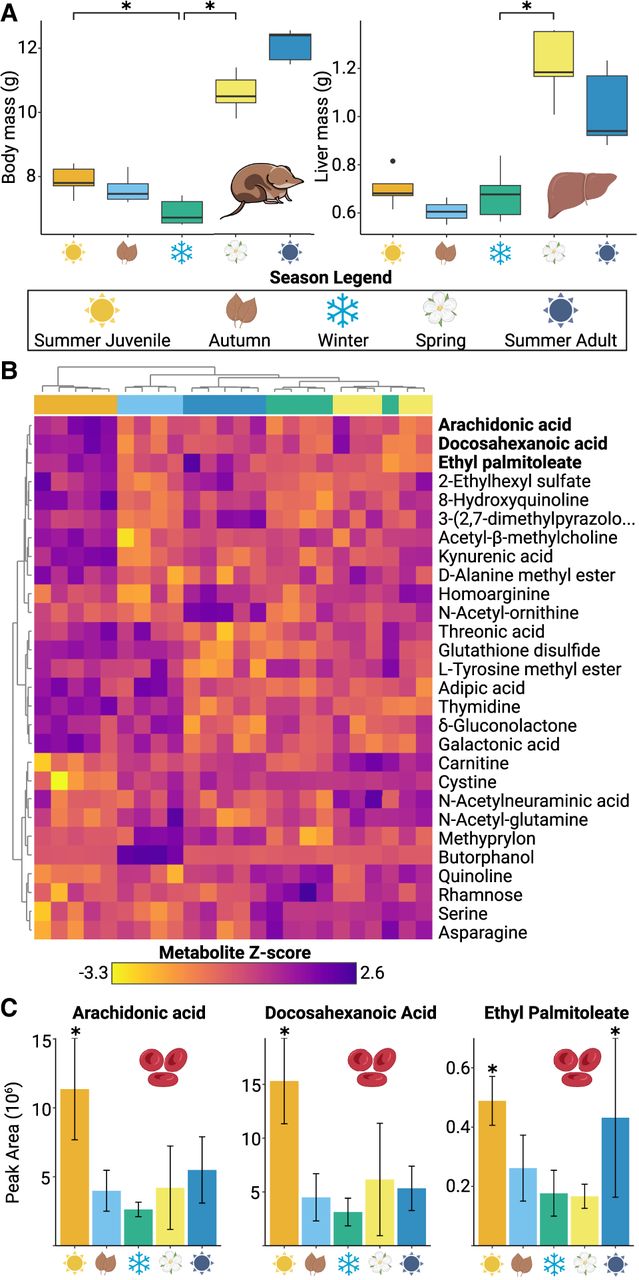
Confirming Dehnel's phenomenon and metabolic profiling of the blood metabolome. (A) Mass change of body and liver through a year of Dehnel's phenomenon. Both the body and the liver begin to decrease in mass as autumn juveniles, with body mass at a minimum as winter juveniles, proceeded by regrowth as spring adults. Asterisks represent significant size changes (adjusted P < 0.05). (B) Heatmap of 28 statistically significant differentially concentrated metabolites between stages of Dehnel's phenomenon. Hierarchical clustering using these significant metabolite groups each profile into each season. (C) Three of these metabolites were lipid metabolites (ethyl palmitoleate, docosahexanoic acid, arachidonic acid), with decreases in autumn, winter, and spring individuals.


