
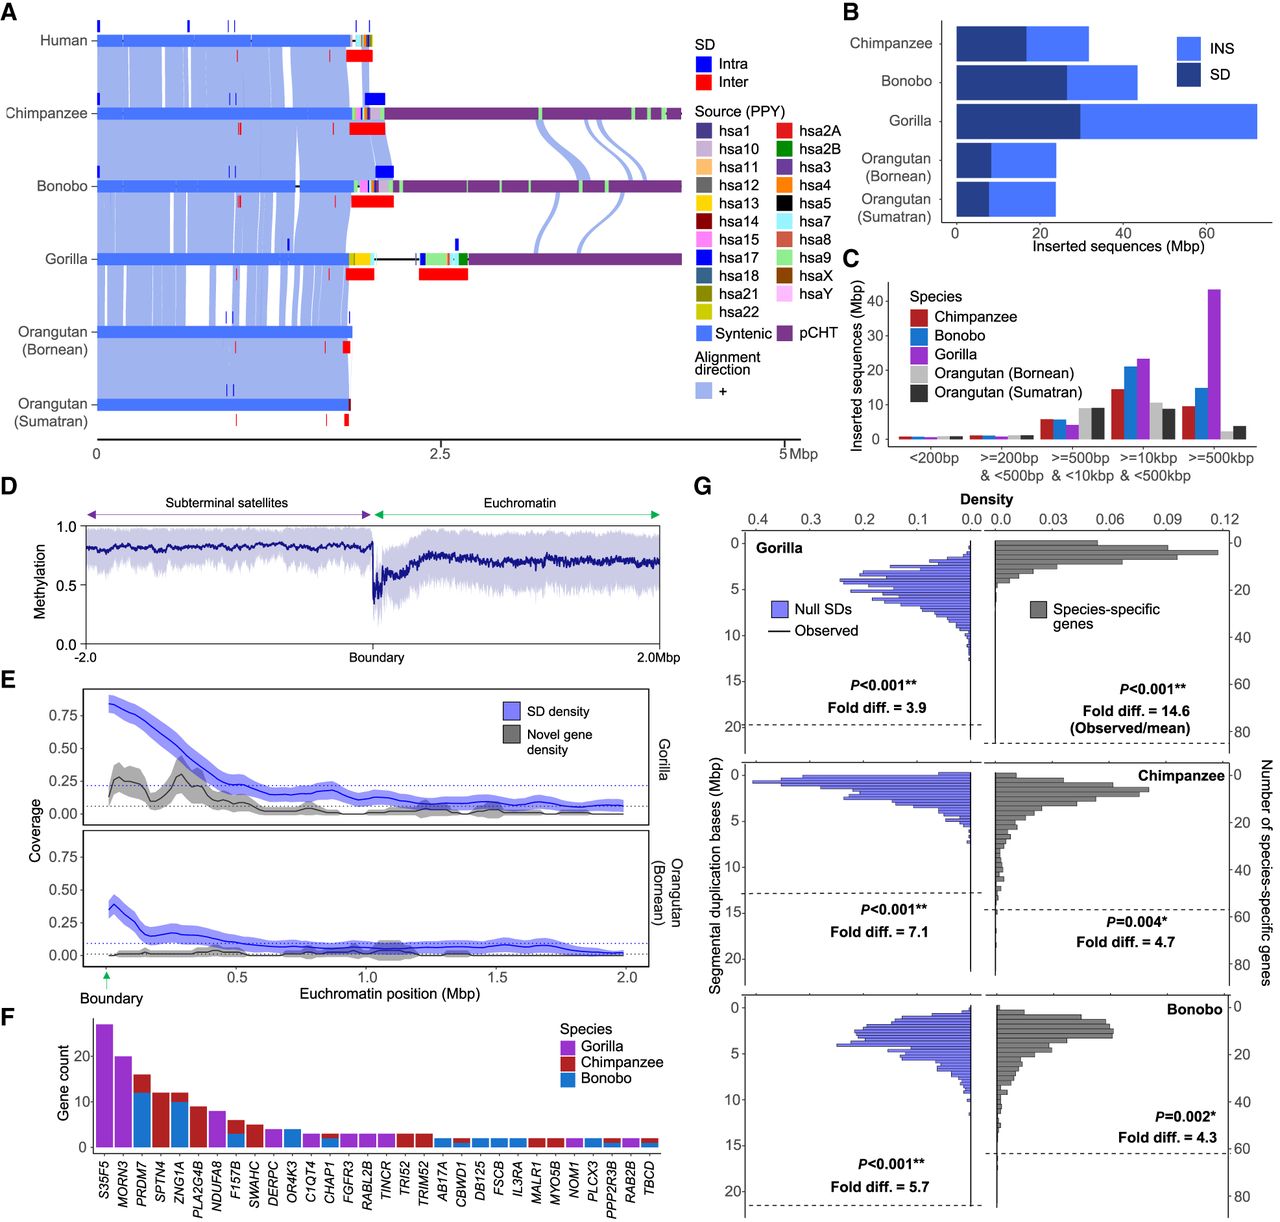
Duplicated genes and epigenetic features of ape genomes with and without subterminal caps. (A) An ape comparative analysis of the organization of subterminal sequences for the long arm of Chromosome hsa16. The stacked alignment plot (SVbyEye) contrasts syntenic euchromatic regions (light blue) with heterochromatic subterminal satellite regions (purple) and with the location of intra (dark blue) and interchromosomal (red) SDs along with the origin of the duplicated sequences (human chromosome designation). (B) The total number of new sequences (insertion [INS] or SD), not present in humans, at subterminal boundaries within 2 Mbp of the euchromatic–heterochromatic transition zone. (C) Size distribution of the total inserted sequences with respect to human genome, color-coded by species. (D) CpG methylation profile within 2 Mbp of the euchromatin–heterochromatin transition for chromosomes with subterminal caps in gorilla. The average percentage of CpG methylation (blue line) with standard deviation (blue shaded area) is shown. (E) The densities of SDs and novel genes at the euchromatic boundaries, highly enriched in gorilla, with subterminal caps, as opposed to the orangutan. The transparent area indicates 95% interval of the observed density. Dotted horizontal line indicates the mean density. (F) Duplicated genes and their copy number located at the boundary of subterminal caps, including eight genes validated by read depth of 120 primates (Mao et al. 2024). (G) Simulations to test enrichment of novel genes (Yoo et al. 2025) and SDs at the boundary of subterminal caps (2 Mbp) in gray and blue, respectively. The p indicates empirical P-value of the one-sided permutation test.


