
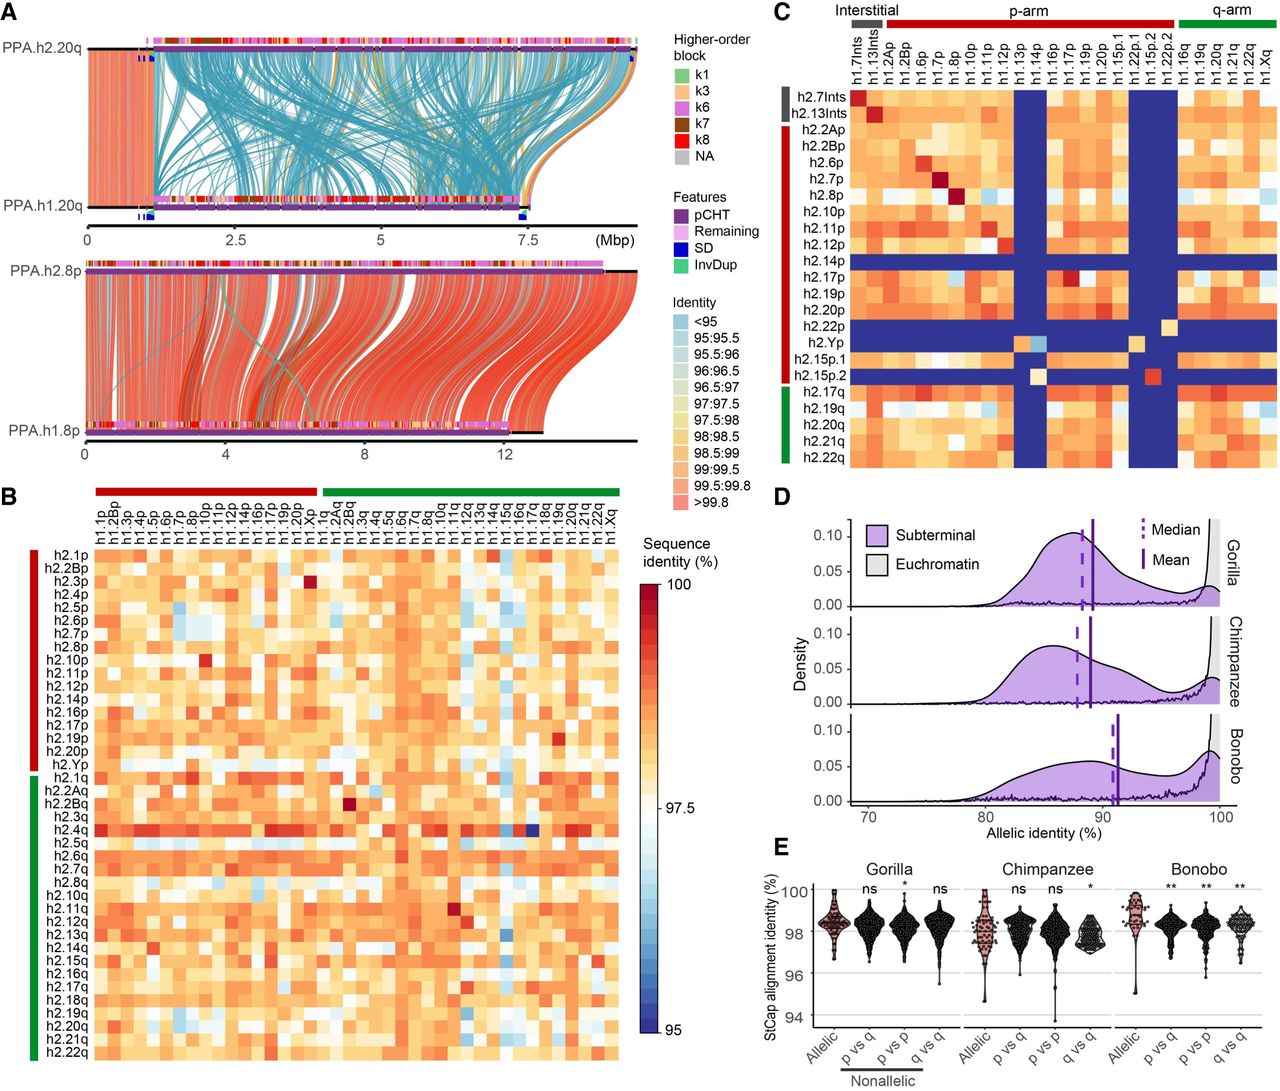
Subterminal allelic versus nonallelic sequence identity. (A) Example of low-identity (hsa20q) and high-identity (hsa8p) allelic subterminal caps in bonobo. Annotations include percentage identity of alignment (scaled from blue <95% to red >99.8%); higher-order block type of pCht satellite arrays (top), satellites (middle), and SD content (bottom). (B,C) Sequence identity matrix between paternal (h2) and maternal (h1) haplotypes of gorilla (B) and bonobo (C) comparing allelic versus nonallelic subterminal loci. The color intensity of blue to red indicates sequence identity (<95%–100%). (D) Distribution of allelic sequence identity of 50 kbp nonoverlapping windows of three African great ape genomes. Allelic sequence identity of the subterminal caps (purple) and the euchromatic regions (gray; excluding centromere, acrocentric and subterminal regions) is compared with the mean (straight) and median (dashed line) indicated. (E) Distribution of average sequence identity between allelic subterminal caps compared with nonallelic subterminal caps. Each dot represents the pairwise comparison. Two-sided permutation test significance is indicated on top; (**) P < 0.0001 and (*) P < 0.05.


