
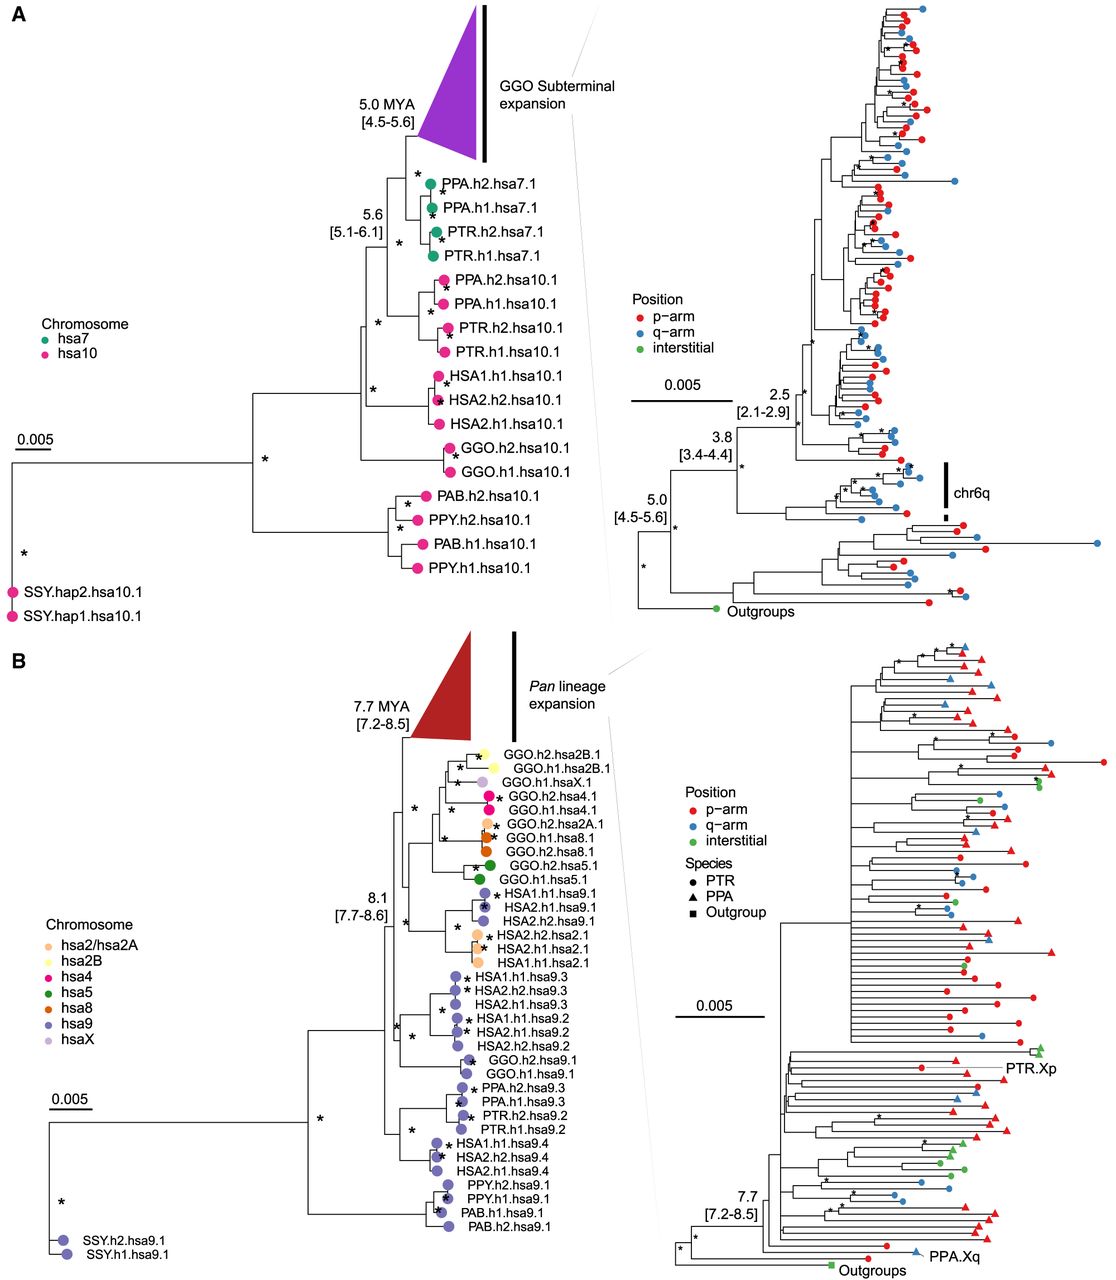
Evolution of subterminal SD spacers. (A,B) Maximum likelihood phylogenetic tree of gorilla (34 kbp; A) and Pan subterminal SDs (32 kbp; B) constructed from total spacers (showing subset of n = 100 copies). In each, the left panel shows the overall topology with a time-scale tree calibrated to orthologous ancestral primate copies. Chromosome numbers (based on human chromosome synteny) are color-coded and labeled by haplotype (h1 or h2) and species acronym: human (HSA; HSA1-CHM13, and HSA2-HG002), chimpanzee (PTR), bonobo (PPA), gorilla (GGO), Sumatran orangutan (PAB), Bornean orangutan (PPY), and siamang (SSY). A colored triangle denotes the subterminal spacer expansion. The right panel zooms into the subterminal spacer topology and time estimates in million years ago (MYA) with 95% confidence interval in the bracket. Gorilla (top) and chimpanzee (bottom) spacers are classified as p-arm (red), q-arm (blue), or interstitial (green). In addition, for the bottom panel, species are indicated as outgroup (rectangle), chimpanzee (circle), or bonobo (triangle) in origin. Internal nodes with bootstrap score higher than 95 are indicated by a star.


