
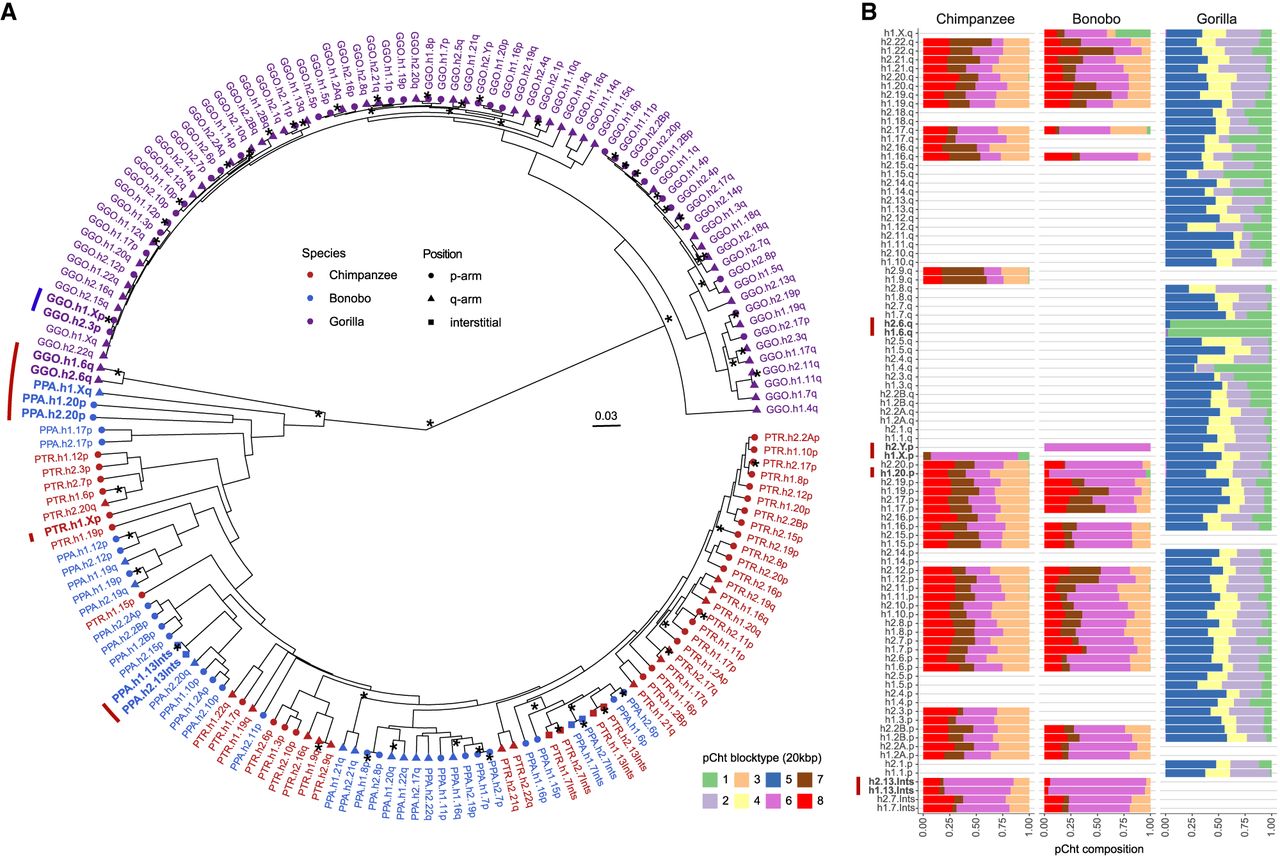
pCht satellite higher-order structure and phylogeny. (A) Clustering of the subterminal arms based on relative abundance of pCht variants. Each terminal node indicates species (chimpanzee, PTR; bonobo, PPA; and gorilla, GGO), human chromosome number, and whether the position of the subterminal cap is located in p-arms, q-arms, or interstitial (Ints). The top 5% of subterminal caps with the largest proportion of shared pCht types (among GGO and Pan) are highlighted (bold/red line) (Supplemental Fig. S7C). GGO.h2.3p versus GGO.h1.Xp (blue line) is an example in which the nonallelic subterminal cap pair is more closely related than the allelic pair. Internal nodes with a bootstrap score higher than 95 are indicated by a star. (B) Identification of eight higher-order block types (20 kbp) of pCht satellites across the subterminal caps of three African great apes. The highest proportion of shared pCht types among chimpanzees and gorillas are indicated (red line).


