
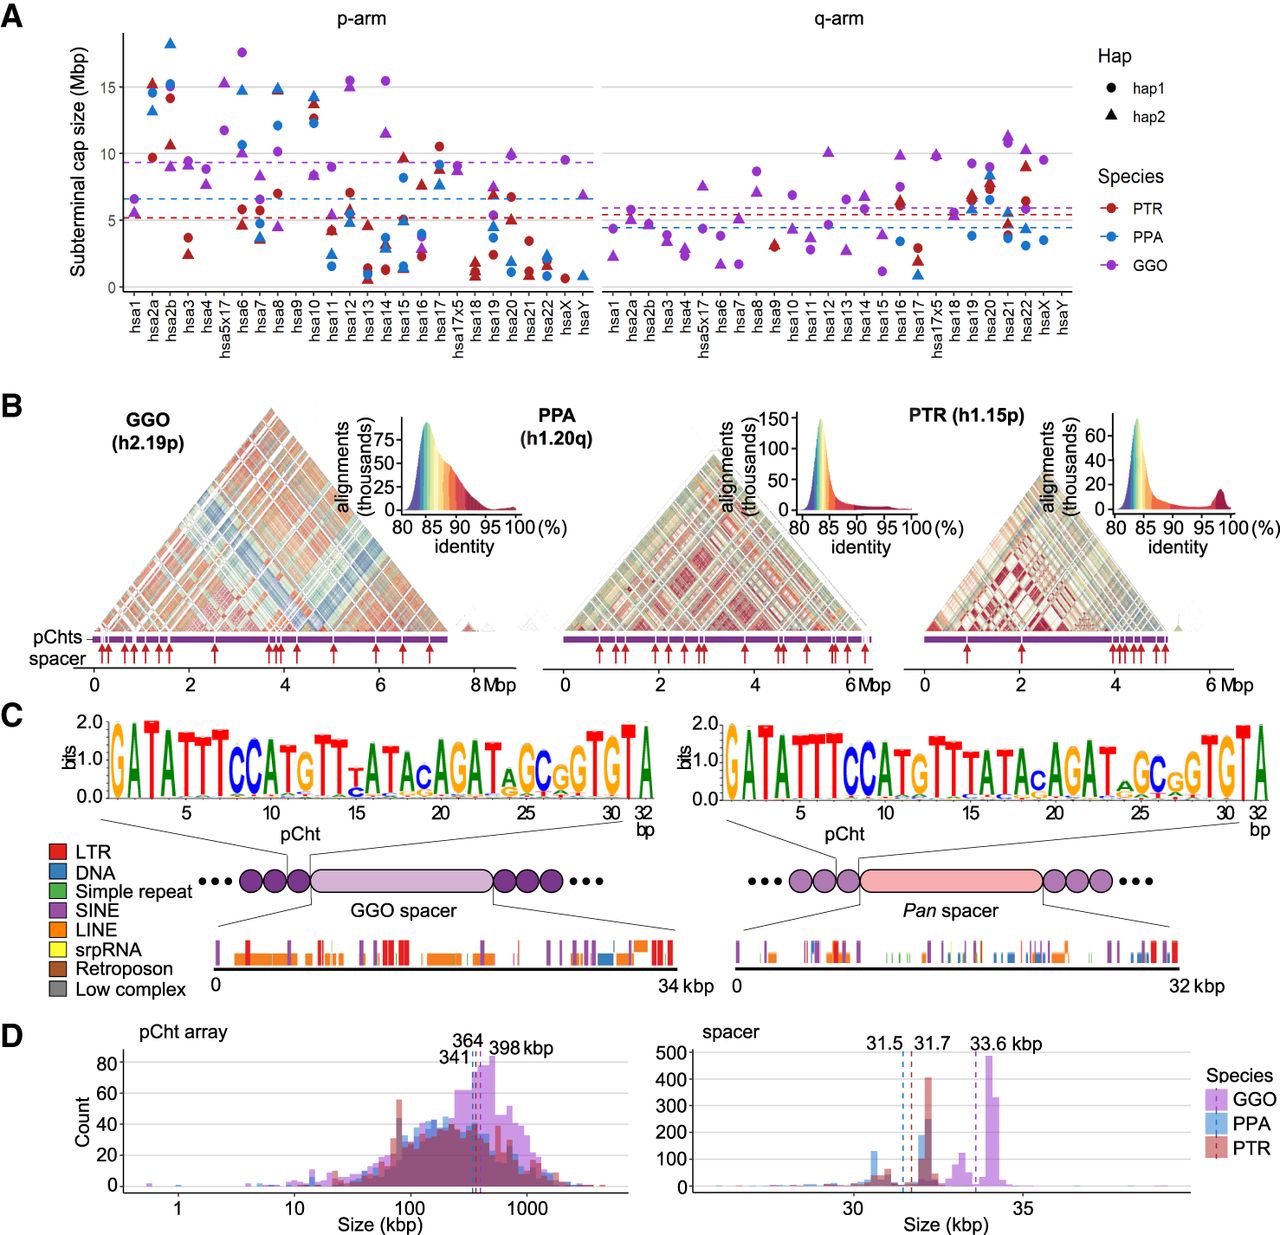
Overview of African great ape subterminal cap organization. (A) Size of p- or q-arm subterminal caps in three species: chimpanzee (PTR), bonobo (PPA), and gorilla (GGO), indicated by red, blue, and purple, respectively. Circles and triangles indicate haplotypes 1 and 2, or maternal and paternal for bonobo and gorilla, respectively. (B) StainedGlass (Vollger et al. 2022) self-alignment plot of subterminal caps including pCht satellites indicated by the purple track below the triangular heatmap, as well as subterminal SD spacers interrupting satellite arrays, indicated by the red arrows below. (C) The structure of subterminal caps. From the top, the logo base profile of pCht satellite is shown, followed by the higher-order structure of subterminal cap sequences, and the sequence composition of the subterminal SDs at the bottom. (D) Size distribution of uninterrupted pCht array and subterminal SDs. The dotted line indicates the mean. The x-axis is in a log10 scale for the pCht array owing to variation in its size.


