
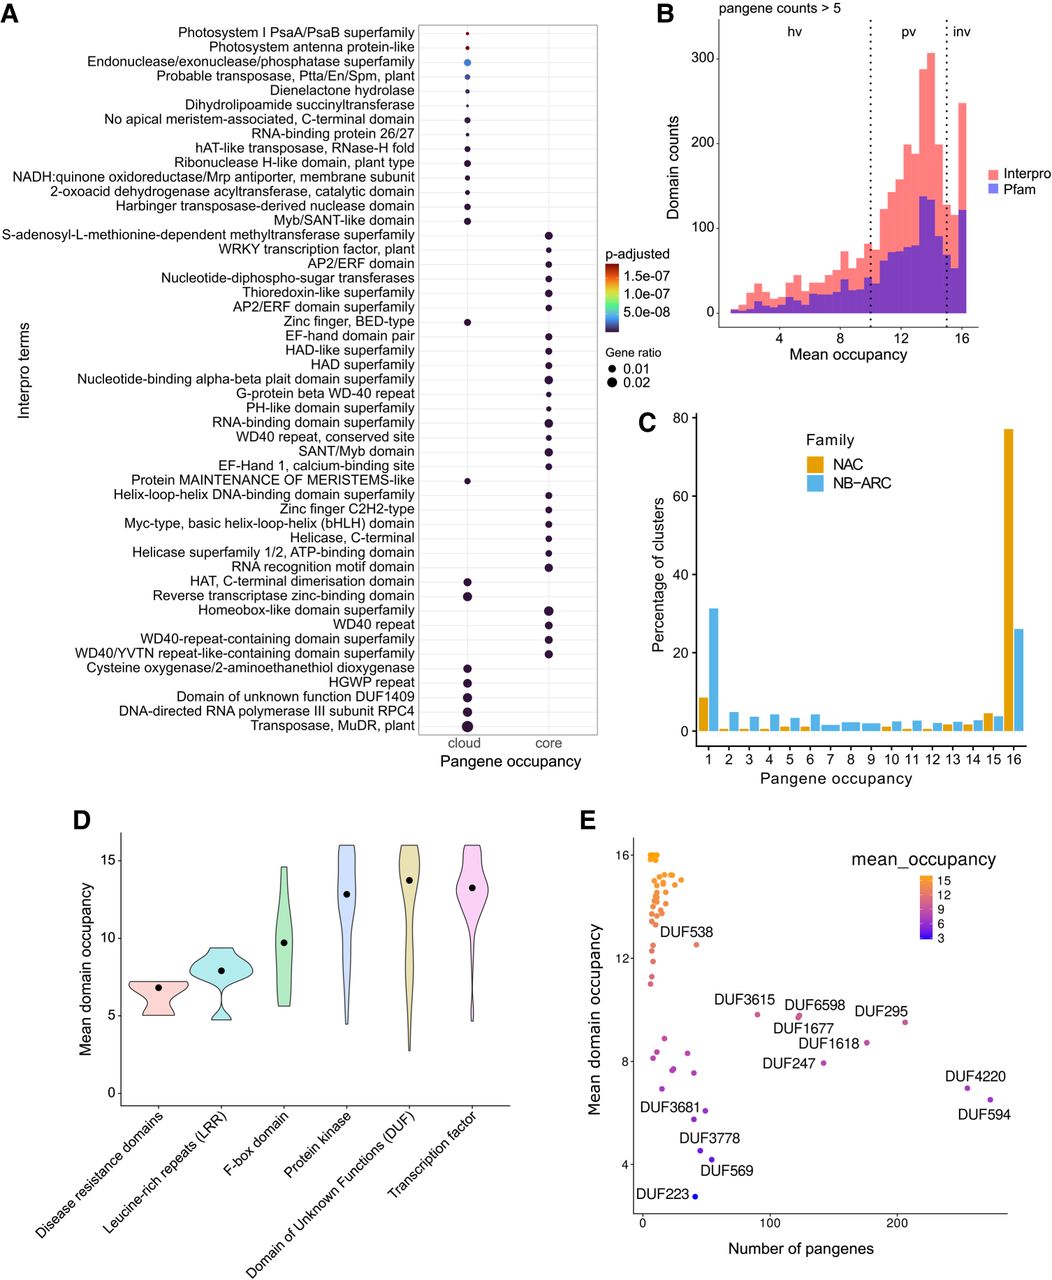
Exploration of predicted pangene domains. (A) Enriched InterPro terms among cloud versus core pangenes. The top 30 terms are shown in the plot. Size of the dot represents the enrichment factor, and the color of the dot shows the P-value. (B) Histogram shows the counts of domains within the pangenes versus their mean domain occupancy for both the Pfam and InterPro domains. The domains were filtered for presence in a minimum of five pangenes. (C) The plot shows the percentage of pangene clusters according to their occupancy status for two gene families: NAC domain-containing TFs and NB-ARC domain-containing genes. (D) The variation in mean domain occupancy of various Pfam domains for the selected major gene groups is shown. The solid back dot shows the median value. (E) The scatterplot shows the mean domain occupancy of various domains under the group “domains with unknown function” (DUFs) versus the number of pangenes with the respective domain. DUFs present in more than 50 pangenes are highlighted in black text.


