
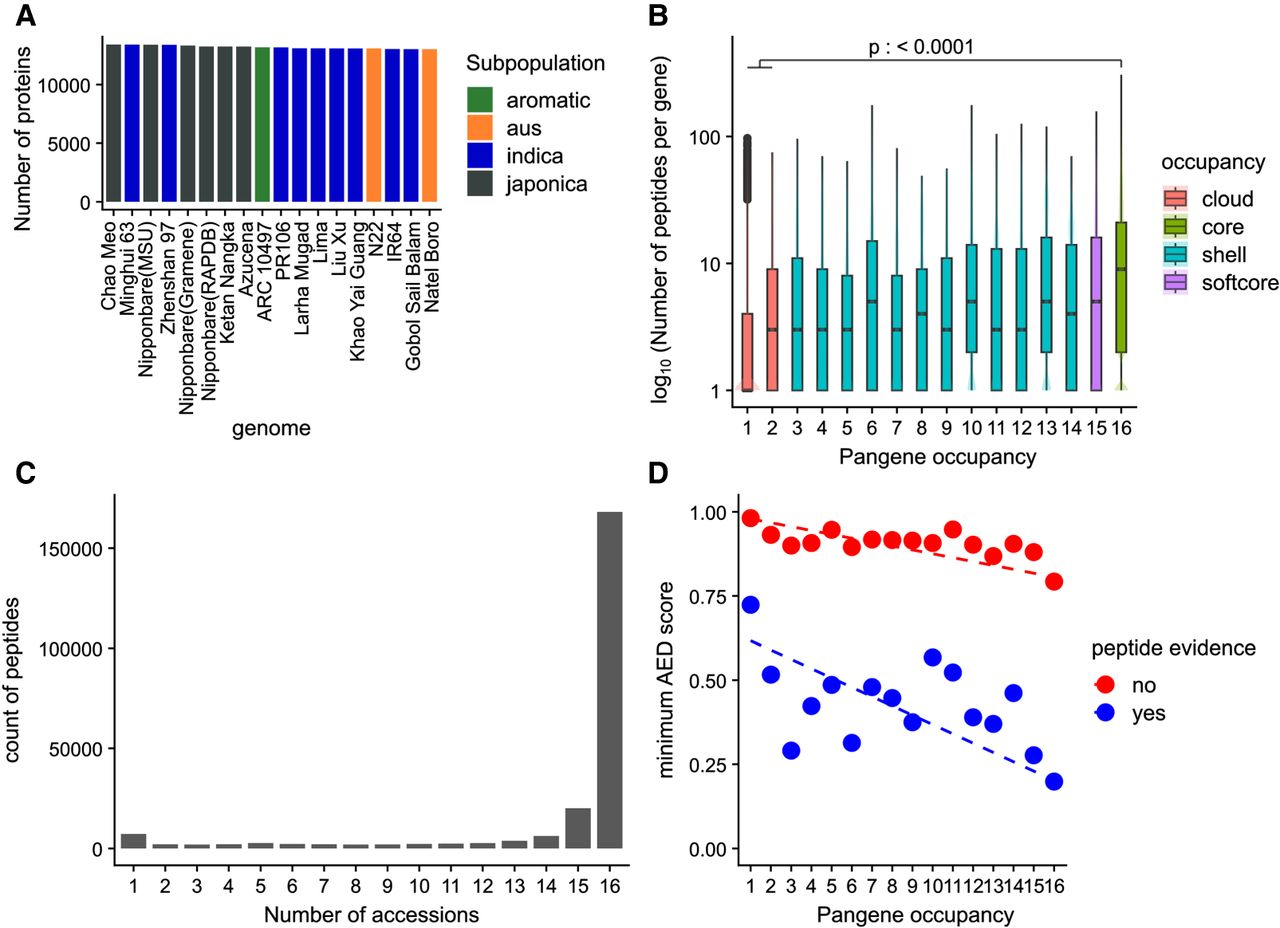
Figure 3.
Experimental proteomics data support for pangenes. (A) Count of proteins per annotation set with at least two supporting peptides; (B) log counts of peptide sequences versus genome occupancy; (C) absolute counts of peptides mapped to proteins from one to 16 genomes; and (D) scatterplot of mean (min) AED score across three transcriptomics data sets for those (RAP-DB) gene products with or without peptide evidence, by genome occupancy of the pangenes. Dashed line indicates linear regression, indicating that gene products with peptide evidence have better (lower AED) support from transcriptomics data. The p-value indicates result from Tukey's HSD test for core versus cloud pangenes.


