
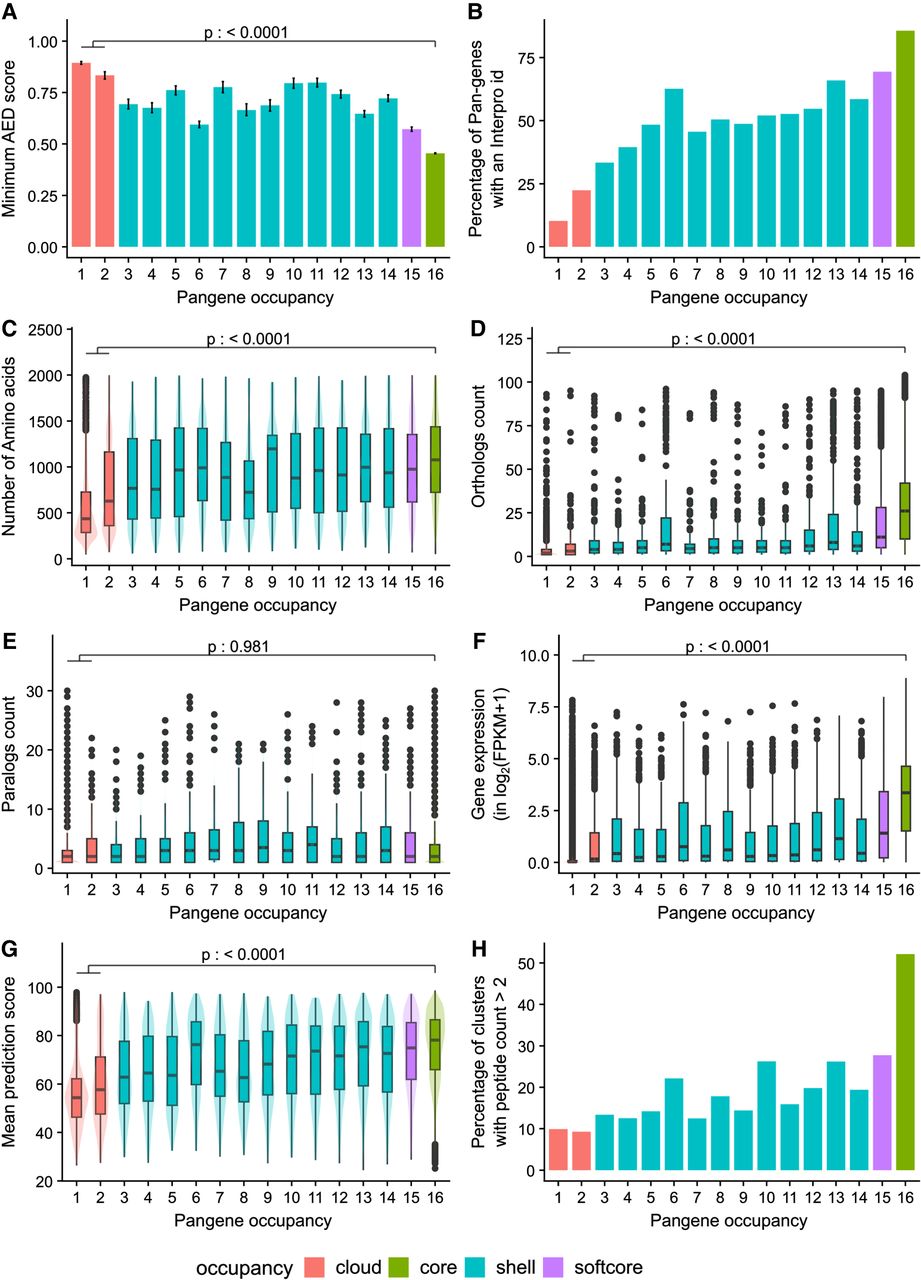
Exploration of pangenes and their properties by their occupancy. The x-axis shows the pangene occupancy for each cluster; the y-axis shows data derived from RAP-DB gene models within those clusters (clusters containing no RAP-DB model are excluded). (A) Mean of minimum AED score from three transcriptomic data sets. (B) Proportion of genes that contain a significant match to an InterPro domain. (C) Mean count of amino acids. (D) Boxplot showing the counts of orthologs derived from Ensembl Compara (see Methods). (E) Boxplot showing counts of paralogs. (F) Boxplot of mean quantitative gene expression data log2(FPKM + 1), sourced from 11,726 rice RNA-seq samples. (G) Boxplot of mean prediction score (pLDDT) from the corresponding AlphaFold2 model. (H) Percentage of clusters with genes having peptide evidence (n > 2 per gene). The p-value indicates result from Tukey's HSD test for core versus cloud pangenes.


