
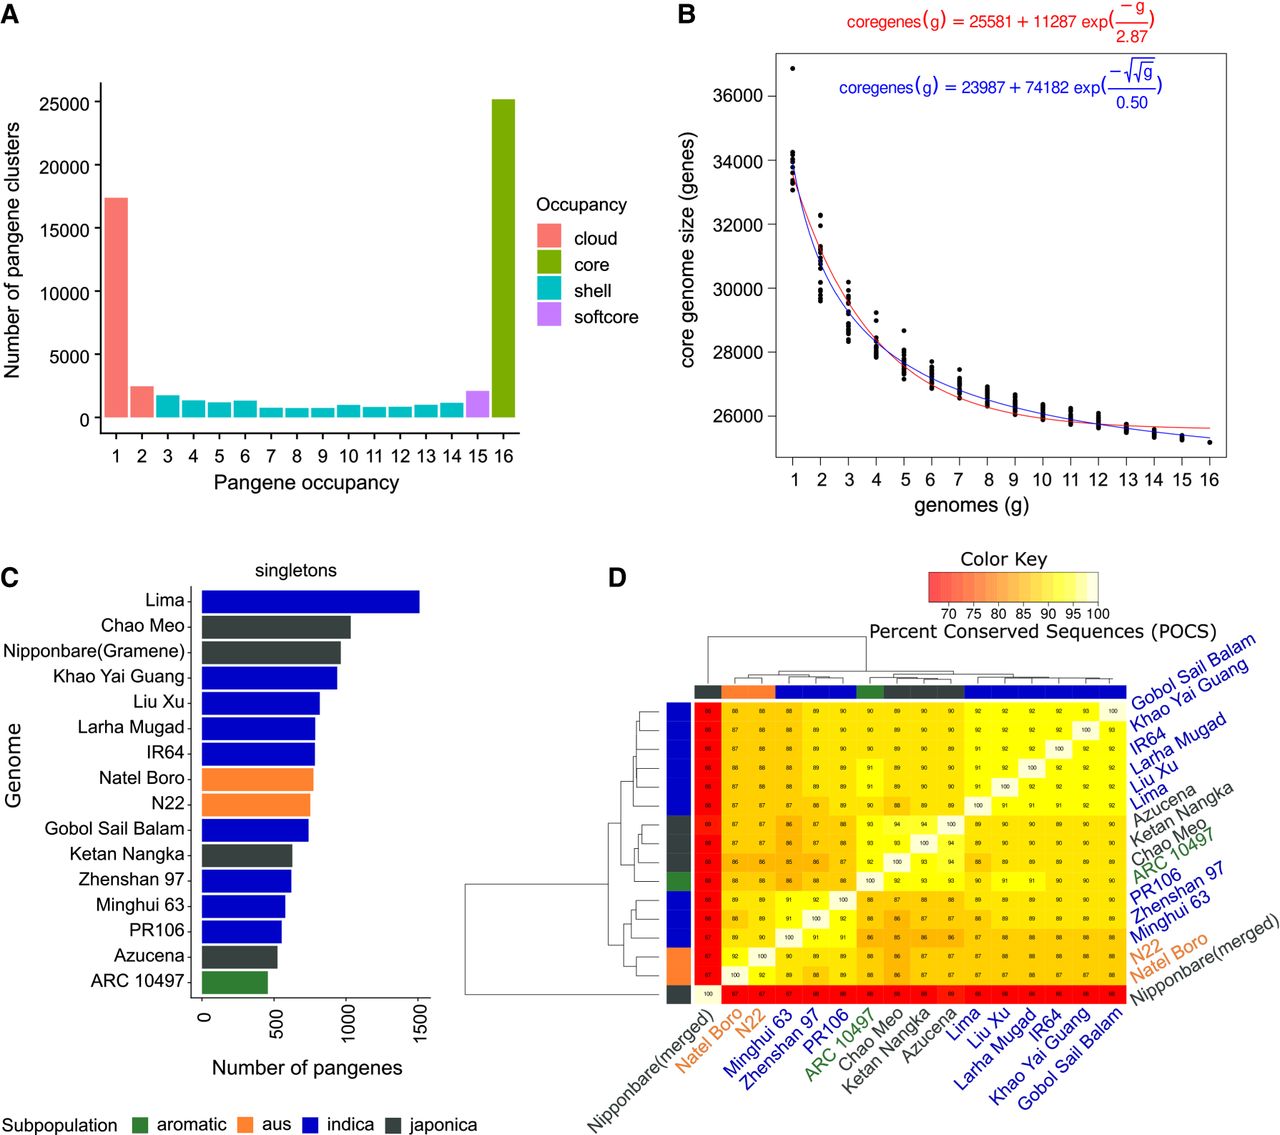
Pangene sets of rice. (A) Count of input genome members (x-axis) “occupancy” 1–16 versus counts of pangenes (pangenes containing only one MSU gene model have been removed). (B) Core-genome growth simulations after adding RPRP cultivars in random order (without singleton genes) using Tettelin (red) (Tettelin et al. 2005) and Willenbrock (blue) (Willenbrock et al. 2007) functions, fitted after 20 permutation experiments. (C) Counts of singletons, that is, genes per input genome present in clusters with no other gene models (for IRGSP, singleton count includes those with an OsNip [Gramene-generated] gene, for unbiased comparison). (D) Matrix of the percentage of shared clusters and heat map of RPRP pangenes. The dendrograms were computed by complete linkage clustering and Euclidean distances computed among columns.


