
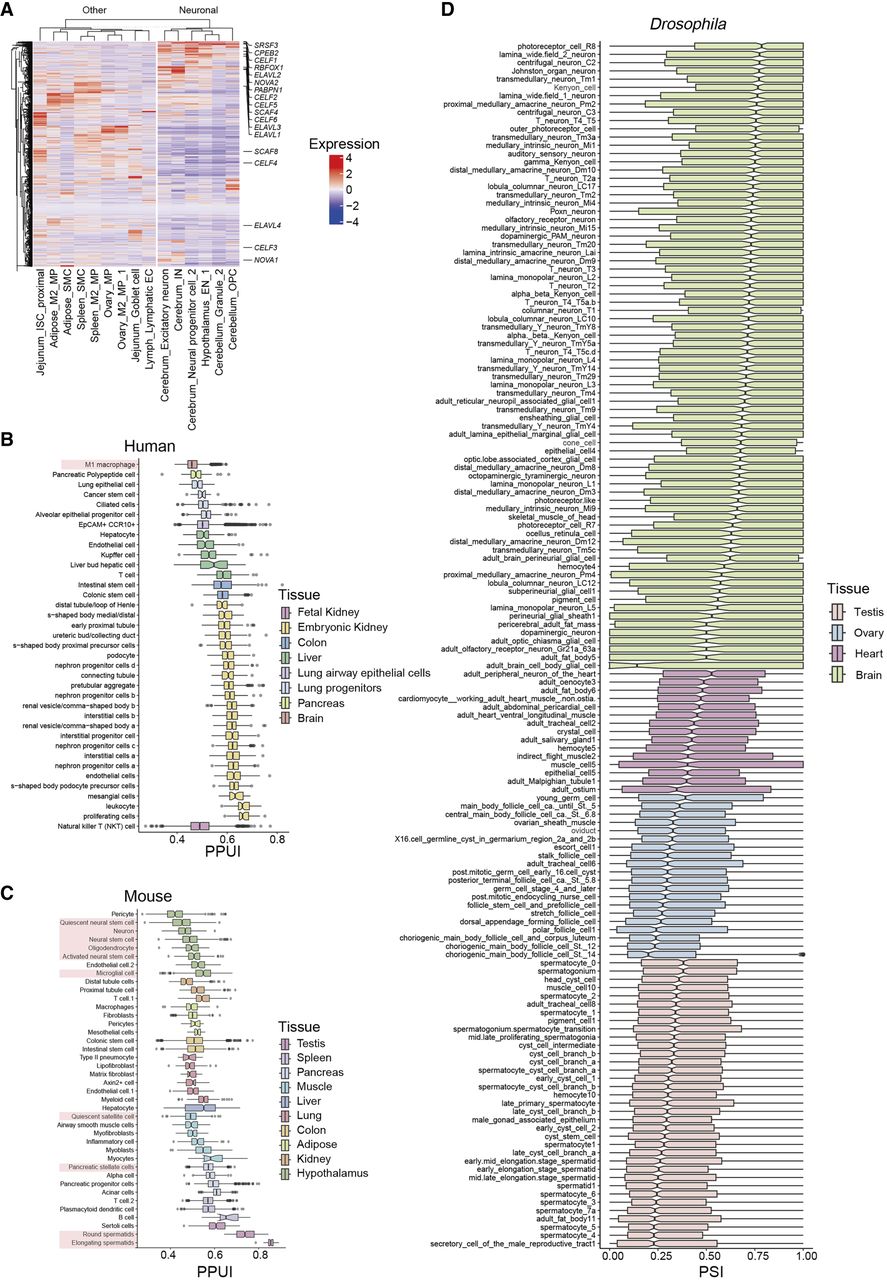
Figure 6.
Comparative analysis of 3′ UTR lengths across cell types in multiple species. (A) Heat map displaying the normalized expression levels of a set of 1304 RBPs across various cell types. (B) Box plot illustrating the variations in relative 3′ UTR lengths across various human cell types. (C) Box plot illustrating the variations in relative 3′ UTR lengths across various mouse cell types. (D) Box plot illustrating the variations in relative 3′ UTR lengths across various Drosophila cell types.


