
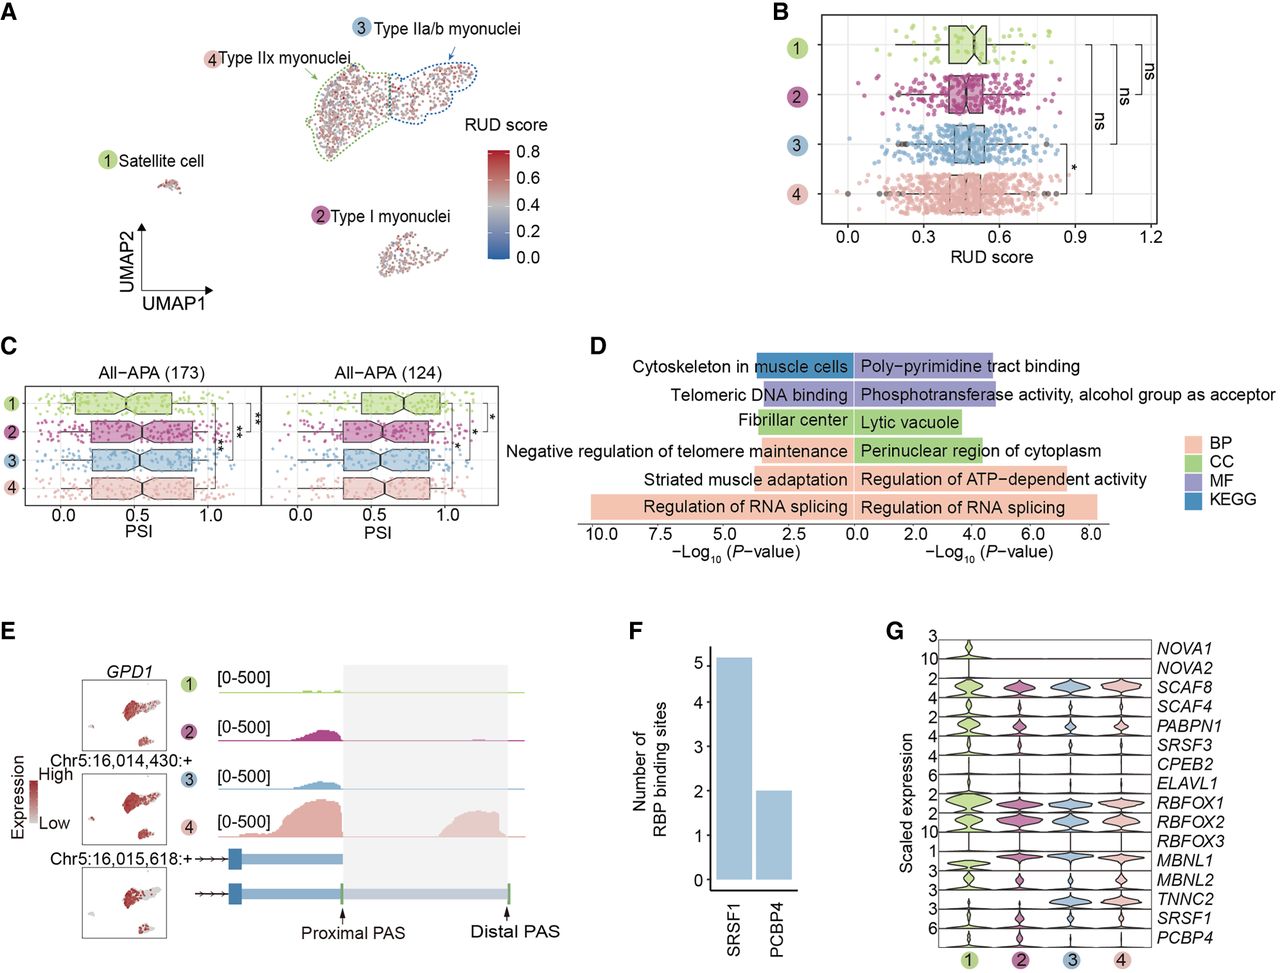
Differential 3′ UTR length during myogenesis in skeletal muscle. (A) UMAP displaying 3′ isoform usage during myogenesis in individual cells. Each dot represents the relative length of the 3′ UTR. (B) Distribution of RUD for different types of muscle cells. Colors correspond to different cell types. The Wilcoxon rank-sum test was used for intergroup comparisons, and the difference between Type IIa/b myonuclei and Type IIx myonuclei was significant (P < 0.05), whereas other comparisons did not show significant differences (n.s.). (C) Expression levels, PAS usage, and genomic tracks around the GPD1 gene. The left box plot shows genes with lengthened 3′ UTRs, and the right box plot shows genes with shortened 3′ UTRs. Colors correspond to different cell types. (D) Significant biological process terms of genes with dynamic 3′ isoform changes. The left box plot shows genes with shortened 3′ UTRs, whereas the right box plot shows genes with lengthened 3′ UTRs. (E) Expression levels and PAS usage of GPD1. The left section features three UMAP plots, the first of which shows gene expression, whereas the subsequent two depict the expression of PASs, with each dot in these two plots representing the expression level of PASs within individual cells. The right section presents an IGV plot. Colors in this plot represent different cell types. (F) Bar plots showing the RNA-binding protein around the differential 3′ UTR between proximal PASs and distal PAS loci of GPD1. (G) The violin plot showing the scaled expression levels of RBP genes.


