
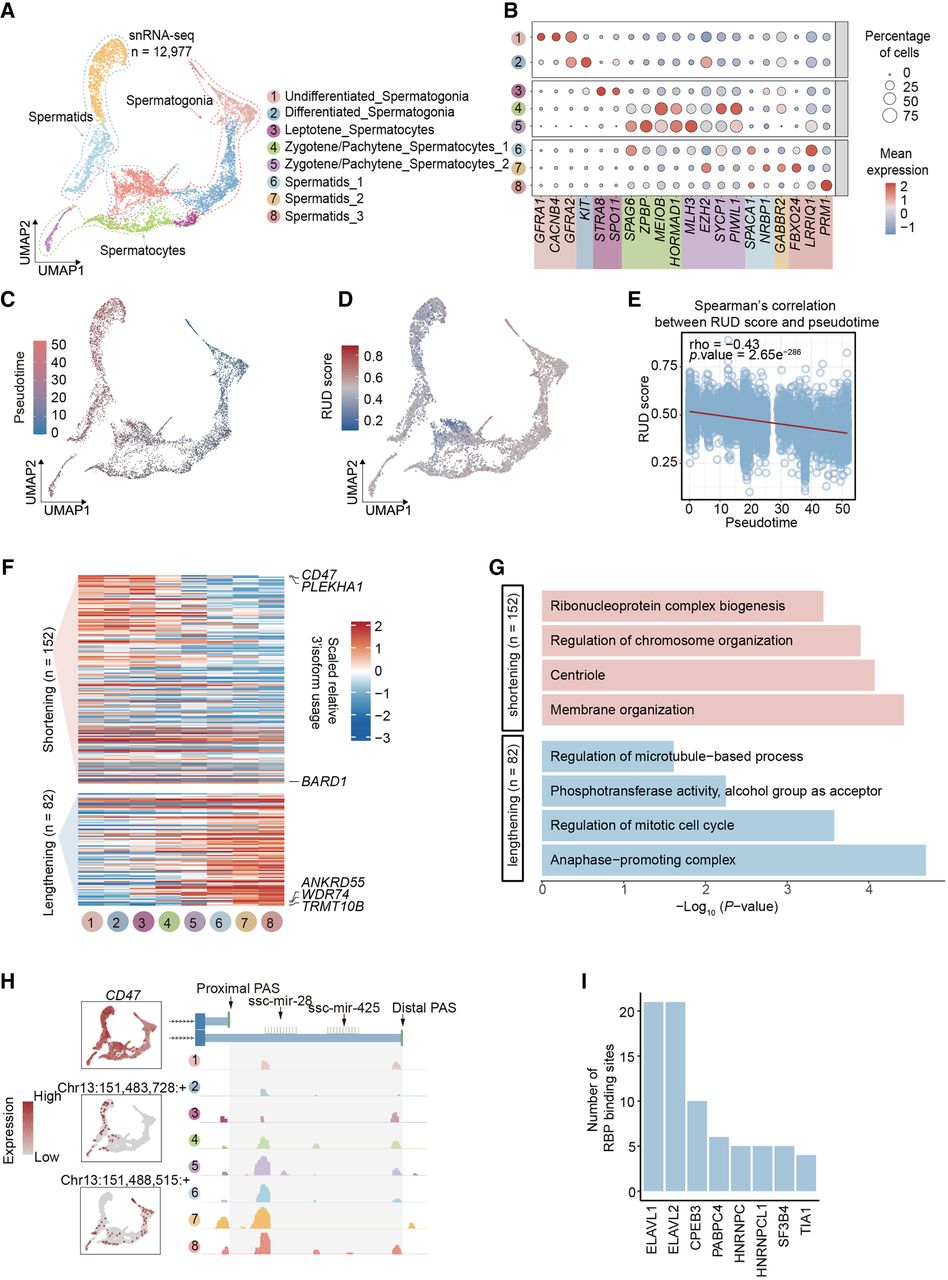
Global 3′ UTR shortening in the testis germ lineage. (A) UMAP visualization showing eight distinct germline cell types during the spermatogenesis process. Each dot represents the gene expression profile of a single cell, with each cell type distinguished by a unique color. (B) Dot plot showing the expression levels of marker genes for each cell type. (C) Pseudotime trajectory plot depicting the dynamic process of spermatogenesis. Each point in the trajectory represents a single cell, colored according to its developmental stage within the spermatogenesis process. (D) UMAP displaying 3′ isoform usage during spermatogenesis in individual cells. Each dot represents the relative length of the 3′ UTR. (E) Spearman's correlation between the RUD score and pseudotime during spermatogenesis. Each point in the correlation plot represents a single cell, with the correlation analysis highlighting the relationship between 3′ UTR length and the progression through pseudotime. (F) The scaled relative usage of 3′ isoforms across different cell types during spermatogenesis. The upper heat map represents genes with shortened 3′ UTRs, and the lower shows genes with lengthened 3′ UTRs. (G) Significant biological process terms of genes with dynamic 3′ isoform changes. (H) Expression levels, PAS usage, and miRNA binding sites around the CD47 gene. The left section features three UMAP plots. The first UMAP plot shows gene expression, and the subsequent two plots depict the expression of PASs. Each dot represents the expression level of PASs within individual cells. The right section presents an IGV plot. Colors in this plot represent different cell types. (I) Bar plots showing the RNA-binding protein around the differential 3′ UTR between proximal PASs and distal PAS loci of CD47.


