
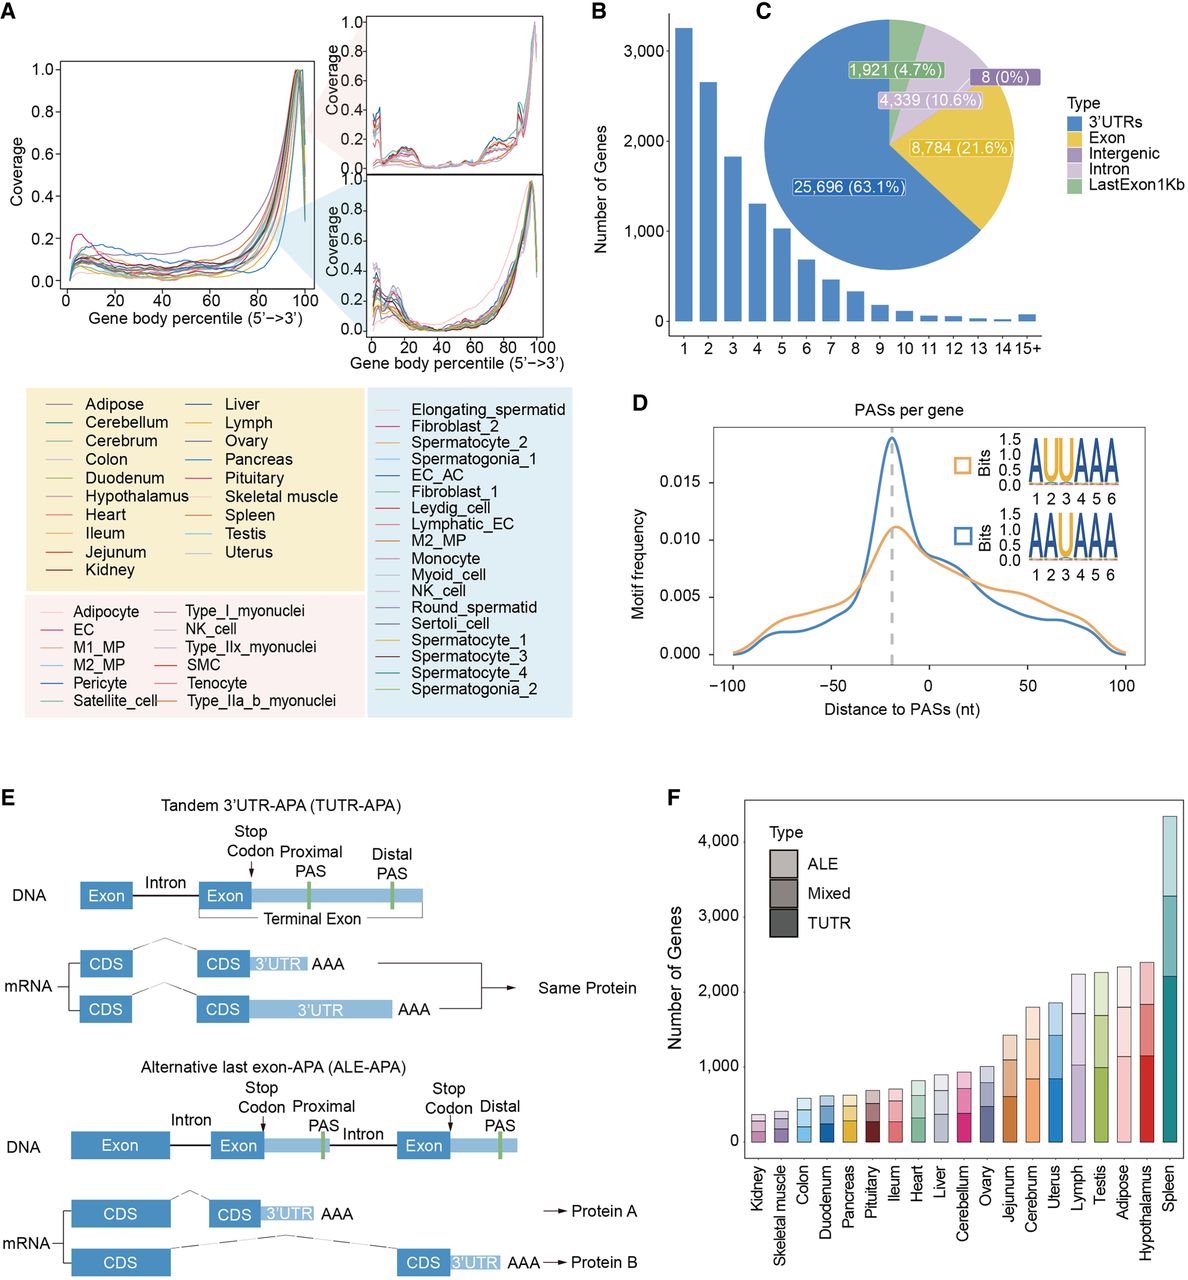
Identification of polyadenylation sites (PASs) using 10x snRNA-seq data. (A) Curve plot showing the coverage of each part of the gene body in 19 different tissues and in each cell type of two representative tissues (skeletal muscle tissue and testicular tissue). The plot on the left represents the percentage coverage of the genomes from 5′ to 3′ in different tissues, and the plot on the right is divided into two parts: the upper right part shows the gene body coverage of different cell types in skeletal muscle; and the lower right part shows the corresponding data in the testis. The x-axis is labeled with genome percentiles, and the y-axis is shown with coverage. (B) Distribution of the number of PASs per gene. (C) Genomic distribution of PASs. (D) Line plots illustrating the distribution of canonical PAS motifs (AAUAAA, AUUAAA), which are positioned from 90 nucleotides upstream to 90 nucleotides downstream of a random PAS selected on a transcript. (E) Two primary classes of 3′ mRNA isoforms generated by APA. (F) Distribution of three different classes of APA genes across 19 tissues.


