
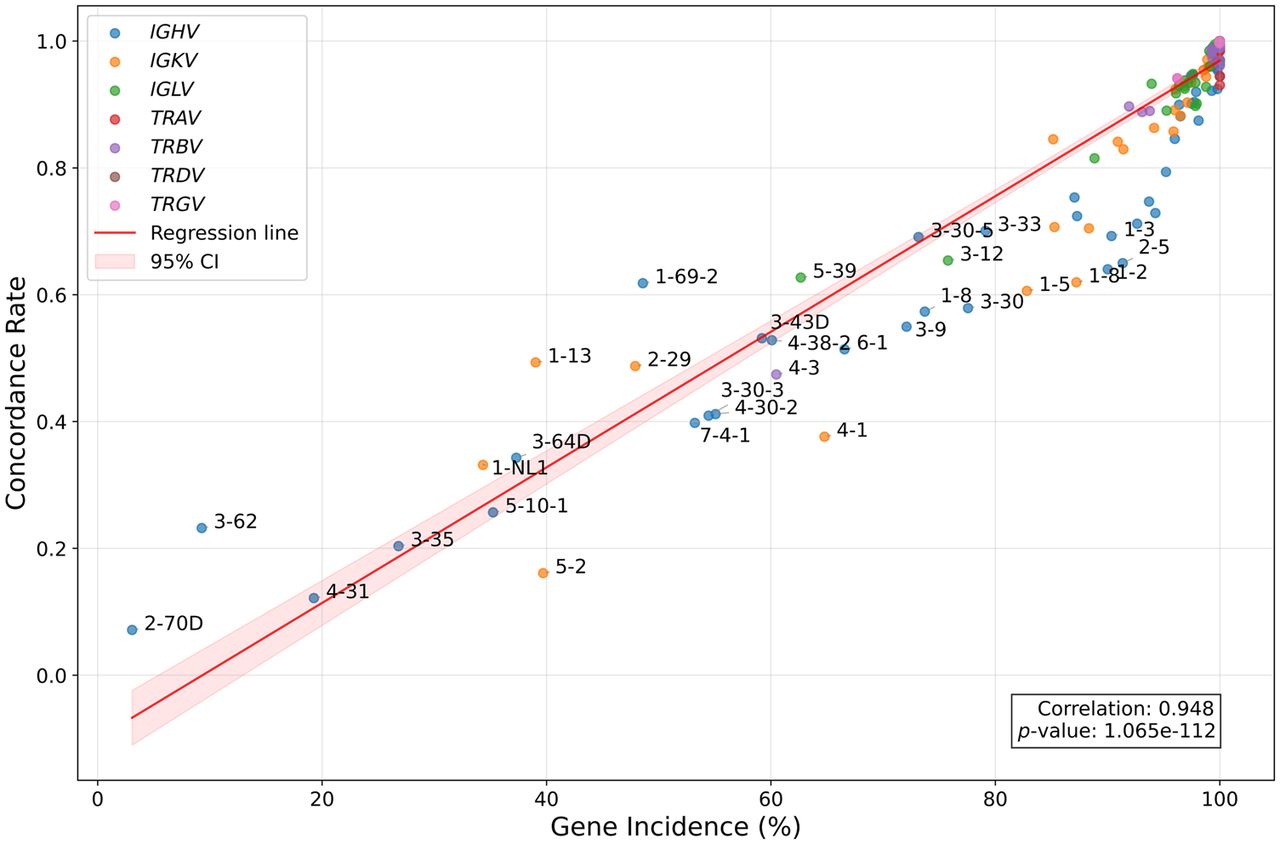
Figure 3.
Relationship between mean concordance across all trios for each gene and the fraction of trios in which the gene is present. Linear regression reveals a strong association, indicating rare alleles have lower concordance across trios. Labeled genes have mean concordance rate values at least 1 SD below the mean (calculated across all gene types).


